Tag: Organic chemistry

  • The Graham reaction: Deciding upon a reasonable mechanism and curly arrow representation.

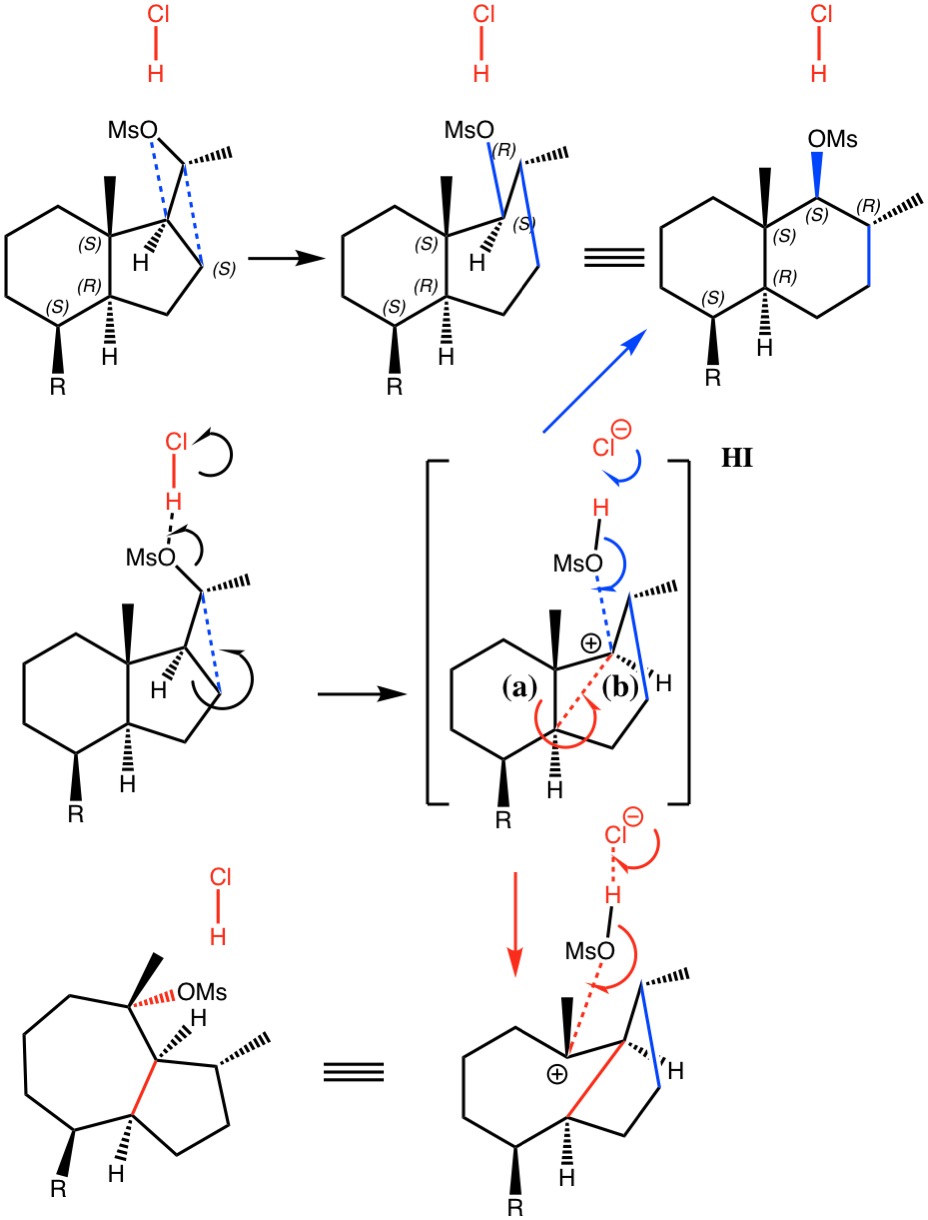
    Students learning organic chemistry are often asked in examinations and tutorials to devise the mechanisms (as represented by curly arrows) for the core corpus of important reactions, with the purpose of learning skills that allow them to go on to improvise mechanisms for new reactions. A common question asked by students is how should such mechanisms be presented in an exam in order to gain full credit? Alternatively, is there a single correct mechanism for any given reaction? To which the lecturer or tutor will often respond that any reasonable mechanism will receive such credit. The implication is that a mechanism is “reasonable” if it “follows the rules”. The rules are rarely declared fully, but seem to be part of the absorbed but often mysterious skill acquired in learning the subject. These rules also include those governing how the curly arrows should be drawn. Here I explore this topic using the Graham reaction.[cite]10.1021/ja00947a040[/cite]

    I start by noting the year in which the Graham procedure was published, 1965. Although the routine representation of mechanism using curly arrows had been established for about 5-10 years by then, the quality of such representations in many articles was patchy. Thus, this one (the publisher will need payment for me to reproduce the diagram here, so I leave you to get it yourself) needs some modern tidying up. In the scheme below, I have also made a small change, using water itself as a base to remove a NH proton, rather than hydroxide anion as used in the article (I will return to the anion later). The immediate reason is that water is a much simpler molecule to use at the start of our investigation than solvated sodium hydroxide. You might want to start with comparing the mechanism above with the literature version[cite]10.1021/ja00947a040[/cite] to discover any differences. 

    The next stage is to compute all of this using quantum mechanics, which will tell us about the energy of the system as it evolves and also identify the free energy of the transition states for the reaction. I am not going to go into any detail of how these energies are obtained, suffice to say that all the calculations can be found at the following DOI: 10.14469/hpc/5045 The results of this exercise are represented by the following alternative mechanism.

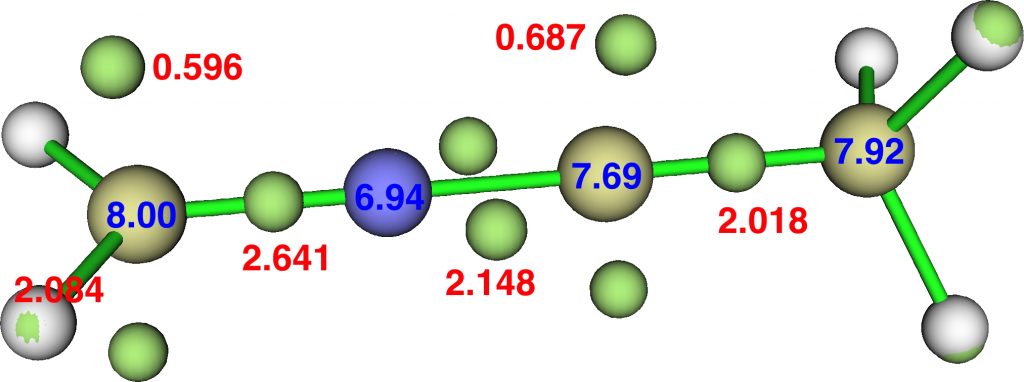
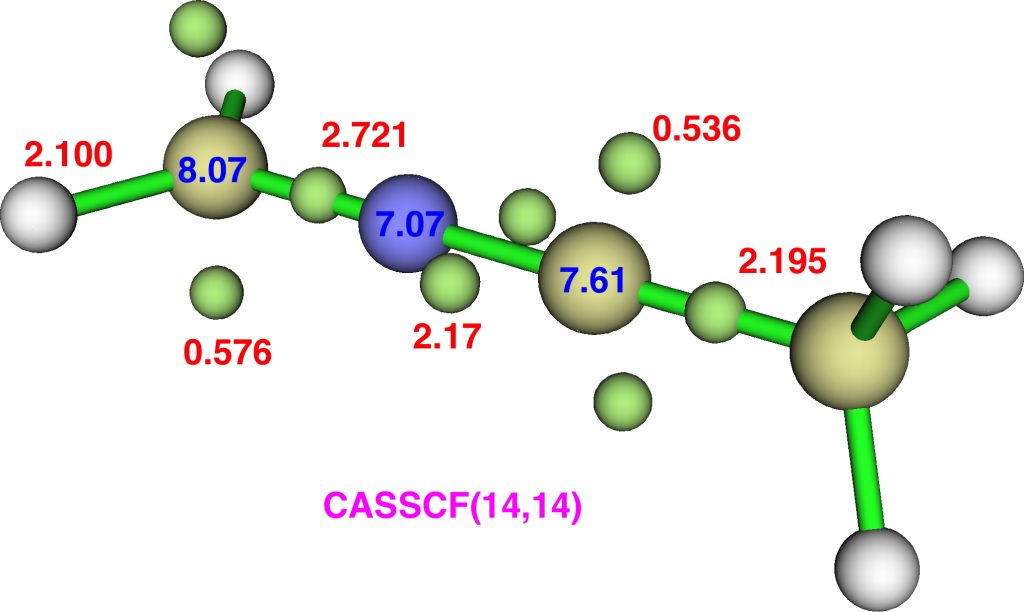
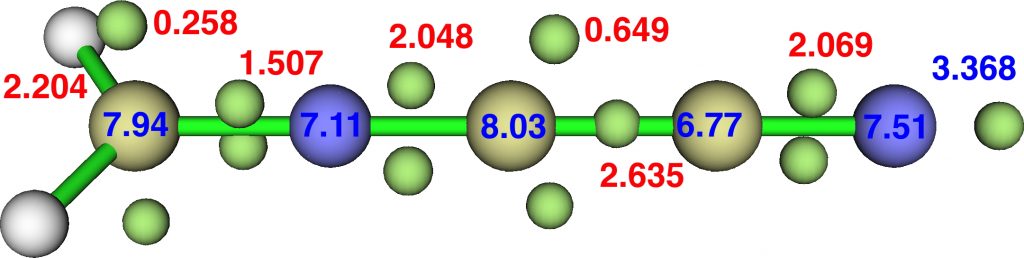
    How was this new scheme obtained? The key step is locating a transition state in the energy surface, a point where the first derivatives of the energy with respect to all the 3N-6 coordinates defining the geometry (the derivative vector) are zero and where the second derivative matrix has just one negative eigenvalue (check up on your Maths for what these terms mean). Each located transition state (which is an energy maximum in just one of the 3N-6 coordinates) can be followed downhill in energy to two energy minima, one of which is declared the reactant of the reaction and the other the product, using a process known as an IRC (intrinsic reaction coordinate). The coordinates of these minima are then inspected so they can be mapped to the conventional representations shown above. New bonds in the formalism above are shown with dashed lines and have an arrow-head ending at their mid-point; breaking bonds (more generally, bonds reducing their bond order) have an arrow starting from their mid-point. The change in geometry along the IRC for TS1 can then be shown as an animation of the reaction coordinate, which you can see below.

    Don’t worry too much about when bonds appear to connect or disconnect, the animation program simply uses a simple bond length rule to do this. The major difference with the original mechanism is that it is the chlorine on the nitrogen also bearing a proton that gets removed. Also, the N-N bond is formed as part of the same concerted process, rather than as a separate step.

    Shown above is the computed energy along the reaction path. Here a “reality check” can be carried out. The activation free energy (the difference between the transition state and the reactant) emerges as a rather unsavoury ΔG=40.8 kcal/mol. Why is this unsavoury? Well, according to transition state theory, the rate of a (unimolecular) reaction is given by the expression: Ln(k/T) = 23.76 – ΔG/RT where T is temperature (~323K in this example), R = is the gas constant and k is the unimolecular rate constant. When you solve it for ΔG=40.8, it turns out to be a very slow reaction indeed. More typically, a reaction that occurs in a few minutes at this sort of temperature has ΔG= ~15 kcal/mol. So this turns out to be an “unreasonable” mechanism, but based on the quantum mechanically predicted rate and not on the nature of the “curly arrows”. And no, one cannot do this sort of thing in an examination (not even on a mobile phone; there is no app for it, yet!) I must also mention that the “curly arrows” used in the above representation are, like the bonds, based on simple rules of connecting a breaking with a forming bond with such an arrow. There IS a method of computing both their number and their coordinates “realistically”, but I will defer this to a future post. So be patient!

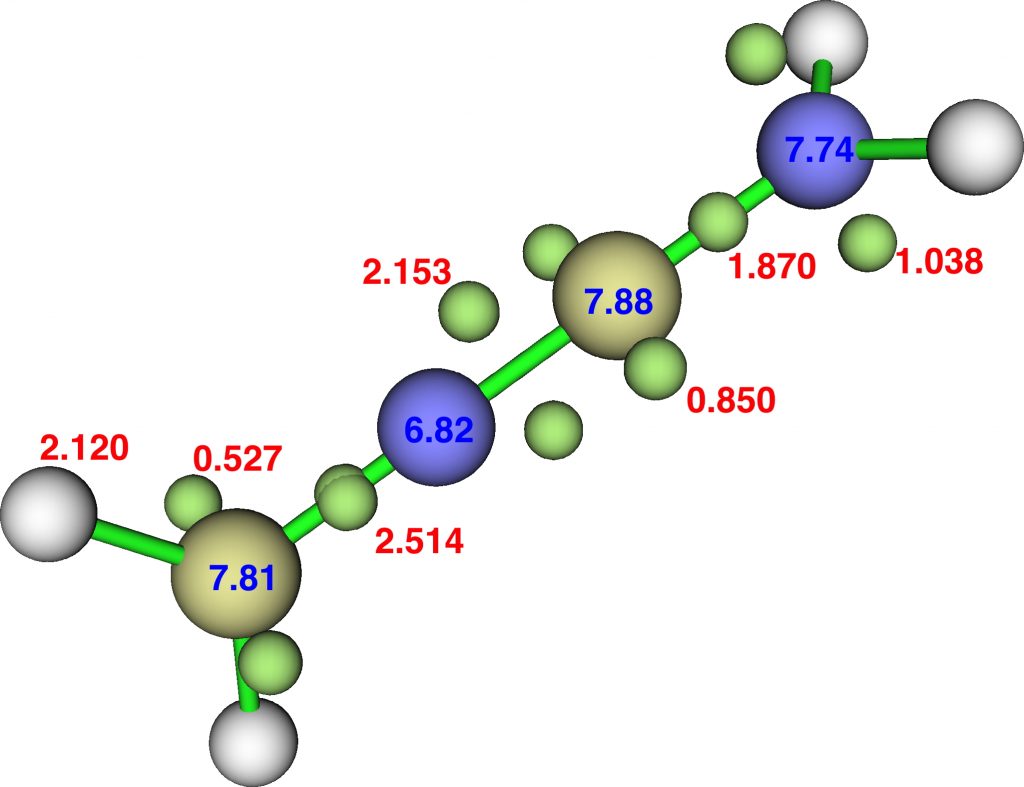
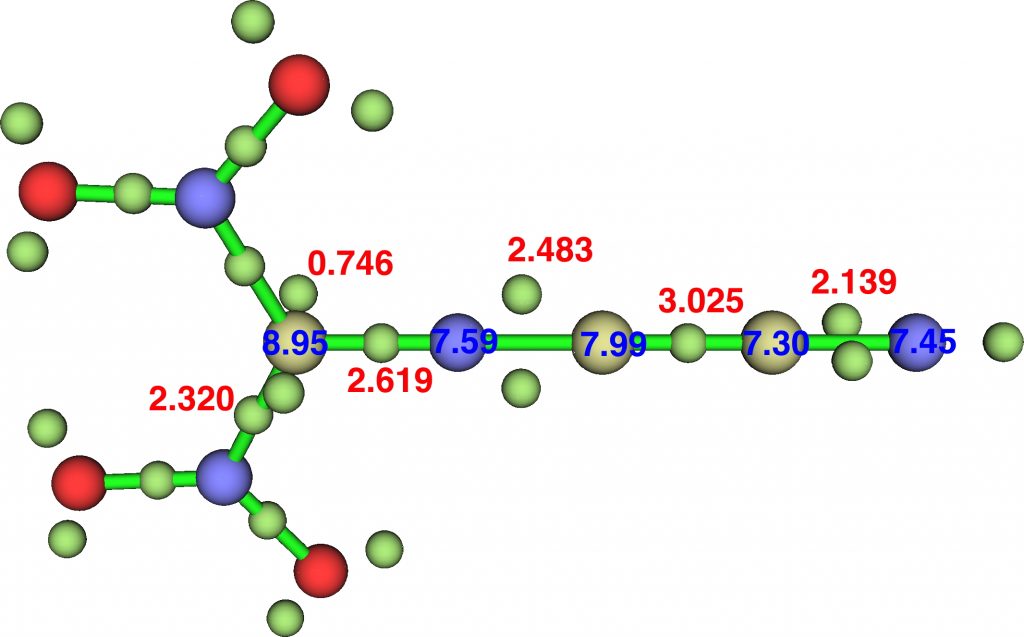
    The next thing to note is that the energy plot shows this stage of the reaction as being endothermic. Time to locate TS2, which it turns out corresponds to the N to C migration of the chlorine to complete the Graham reaction. As it happens, TS2 is computed to be 10.6 kcal/mol lower than TS1 in free energy, so it is not “rate limiting”.

    To provide insight into the properties of this reaction path, a plot of the calculated dipole moment along the reaction path is shown. At the transition state (IRC value = 0), the dipole moment is a maximum, which suggests it is trying to form an ion-pair, part of which is the diazacylopropenium cation shown in the first scheme above. The ion-pair is however not fully formed, probably because it is not solvated properly.

    We can add the two reaction paths together to get the overall reaction energy, which is no longer endothermic but approximately thermoneutral. Things are still not quite “reasonable” because the actual reaction is exothermic.

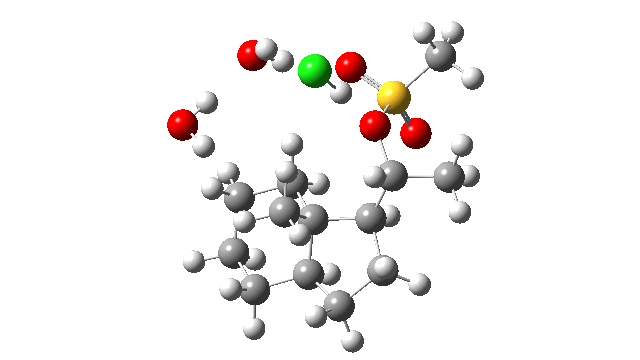
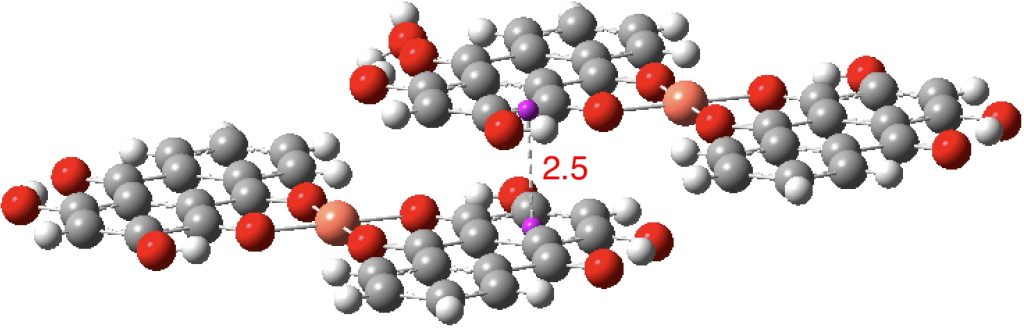
    Time then to move on to hydroxide anion as the catalytic base, in the form of sodium hydroxide. To do this, we need to include lots of water molecules (here six), primarily to solvate the Na+ (shown in purple below) but also any liberated Cl. You can see the water molecules moving around a lot as the reaction proceeds, via again TS1 to end at a similar point as before.

    The energy plot is now rather different. The activation energy is now lower than the 15 kcal/mol requirement for a fast reaction; in fact ΔG= 9.5 kcal/mol and overall it is already showing exothermicity. What a difference replacing a proton (from water) by a sodium cation makes!

    Take a look also at this dipole moment plot as the reaction proceeds! TS1 is almost entirely non-ionic!

    To complete the reaction, the chlorines have to rearrange. This time a rather different mode is adopted, as shown below, termed an Sn2′ reaction. The energy of TS2′ is again lower than TS1, by 9.2 kcal/mol. Again no explicit diazacylopropenium cation-anion pair (an aromatic 4n+2, n=0 Hückel system) is formed.


    Combing both stages of the reaction as before. The discontinuity in the centre is due to further solvent reorganisation not picked up at the ends of the two individual IRCs which were joined to make this plot. Note also that the reaction is now appropriately exothermic overall.

    So what have we learnt?

    1. That a “reasonable” mechanism as shown in a journal article, and perhaps reproduced in a text-book, lecture or tutorial notes or even an examination, can be subjected in a non-arbitrary manner to a reality check using modern quantum mechanical calculations.
    2. For the Graham reaction, this results in a somewhat different pathway for the reaction compared to the original suggestion.
      1. In particular, the removal of chlorine occurs from the same nitrogen as the initial deprotonation
      2. This process does not result in an intermediate nitrene being formed, rather the chlorine removal is concerted with N-N bond formation.
      3. The resulting 1-chloro-1H-diazirine does not directly ionize to form a diazacyclopropenium cation-chloride anion ion pair, but instead can undertake an Sn2′ reaction to form the final 3-chloro-3-methyl-3H-diazirine.
    3. A simple change in the conditions, such as replacing water as a catalytic agent with Na+OH(5H2O) can have a large impact on the energetics and indeed pathways involved. In this case, the reaction is conducted in NaOCl or NaOBr solutions, for which the pH is ~13.5, indicating [OH] is ~0.3M.
    4. The curly arrows here are “reasonable” for the computed pathway, but are determined by some simple formalisms which I have adopted (such as terminating an arrow-head at the mid-point of a newly forming bond). As I hinted above, these curly arrows can also be subjected to quantum mechanical scrutiny and I hope to illustrate this process in a future post.

    But do not think I am suggesting here that this is the “correct” mechanism, it is merely one mechanism for which the relative energies of the various postulated species involved have been calculated relatively accurately. It does not preclude that other, perhaps different, routes could be identified in the future where the energetics of the process are even lower. 
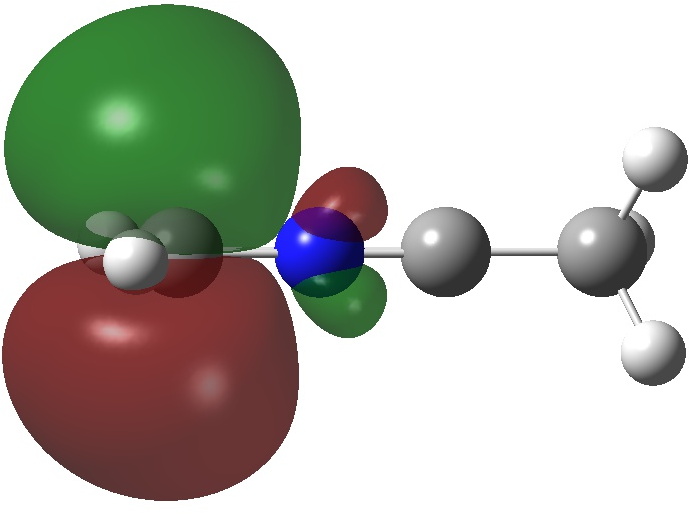

    This blog is inspired by the two students who recently asked such questions. In fact, you also have to acquire this completely unrelated article[cite]10.1021/ja00947a041[/cite] for reasons I leave you to discover yourself. You might want to consider the merits or demerits of an alternative way of showing the curly arrows. Is this representation “more reasonable”? I thank Ed Smith for measuring this value for NaOBr and for suggesting the Graham reaction in the first place as an interesting one to model.

  • Free energy relationships and their linearity: a test example.

    Linear free energy relationships (LFER) are associated with the dawn of physical organic chemistry in the late 1930s and its objectives in understanding chemical reactivity as measured by reaction rates and equilibria.

    The Hammett equation is the best known of the LFERs, albeit derived “intuitively”. It is normally applied to the kinetics of aromatic electrophilic substitution reactions and is expressed as;

    log KR/K0 = σRρ (for equilibria) and extended to log kR/k0 = σRρ for rates.

    The equilibrium constants are normally derived from the ionisation of substituted benzoic acids, with Kbeing that for benzoic acid itself and Kthat of a substituted benzoic acid, with σR being known as the substituent constant and ρ the reaction constant. The concept involved obtaining the substituent constants by measuring the ionisation equilibria. The value of σis then assumed to be transferable to the rates of reaction, where the values can be used to obtain reaction constants for a given reaction. The latter would then be assumed to give insight into the electronic nature of the transition state for that reaction.

    The term log kR/k(the ratio of rates of reaction) can be related to ΔΔG = -RT ln kR/kand this latter quantity can be readily obtained from quantum calculations, where ΔΔG is the difference in computed reaction activation free energies for two substituents (of which one might be R=H). The most interesting such Hammett plots are the ones where a discontinuity becomes apparent. The plot comprises two separate linear relationships, but with different slopes. This is normally taken to indicate a change of mechanism, on the assumption that the two mechanisms will have different responses to substituents. 

    A test of this is available via the calculated activations energies for acid catalyzed cyclocondensation to give furanochromanes[cite]10.1039/c8sc04302g[/cite] which is a two-step reaction involving two transition states TS1 and TS2, either of which could be rate determining. A change from one to the other would constitute a change in mechanism. In this example, TS1 involves creation of a carbocationic centre which can be stabilized by the substituent on the Ar group; TS2 involves the quenching of the carbocation by a nucleophilic oxygen and hence might be expected to respond differently to the substituents on Ar. As it happens, the reaction coordinate for TS2 is not entirely trivial, since it also includes an accompanying proton transfer which might perturb the mechanism.

    Fortunately for this reaction we have available full FAIR data (DOI: 10.14469/hpc/3943), which includes not only the computed free energies for both sets of transition states but also the entropy-free enthalpies for comparison. This allows the table below to be generated. For each substituent, the highest energy point is in bold, indicating the rate limiting step. The span of substituents corresponds to a range of rate constants of almost 1010, which in fact is rarely if ever achievable experimentally.

    Highest free energy overall route for HCl catalysed mechanism,

    trans stereochemistry

    Sub ΔH/ΔG Reactant ΔH/ΔG, TS1 ΔH/ΔG, TS2 RDS
    p-NH2 0.2/6.36 0.0/0.0 0.15/4.0 0.2/6.4 TS2/TS2
    p-OMe 2.7/8.48 0.0/0.0 2.7/8.45 2.1/8.48 TS1/TS2
    p-Me 5.5/10.00 0.0/0.0 5.5/9.9 3.9/10.00 TS1/TS2
    p-Cl 7.7/12.28 0.0/0.0 7.7/12.28 5.9/11.84 TS1/TS1
    p-H 7.6/13.01 0.0/0.0 7.6/13.01 5.5/11.51 TS1/TS1
    p-CN 10.6/18.02 0.0/0.0 10.6 /17.61 10.5/18.02 TS1/TS2
    p-NO2 12.4/19.85 0.0/0.0 12.4/18.24 12.0/19.85 TS1/TS2

    For the free energies, you can see that TS2 is the rate limiting step for the first two electron donating substituents, and the last two electron withdrawing ones, whilst TS1 represents the rate limiting step for the middle substituents. This represents two changes of rate limiting step over the entire range of substituents. A different picture emerges if only the enthalpies are used. Now TS1 is rate limiting for essentially all the substituents. The difference of course arises because of significant changes to the entropy of the transition states. The Hammett equation, and its use of  σconstants to try to infer the electronic response of a reaction mechanism, does not really factor in entropic responses. Nor is it often if at all applied using a really wide range of substituents. So any linearity or indeed non-linearity in Hammett plots may correspond only very loosely to the underlying mechanisms involved.

    Starting in the 1940s and lasting perhaps 40-50 years, thousands of different reaction mechanisms were subjected to the Hammett treatment during the golden era of physical organic chemistry, but very few have been followed up by exploring the computed free energies, as set out above. One wonders how many of the original interpretations will fully withstand such new scrutiny and in general how influential the role of entropy is.

  • Epoxidation of ethene: a new substituent twist.

    Five years back, I speculated about the mechanism of the epoxidation of ethene by a peracid, concluding that kinetic isotope effects provided interesting evidence that this mechanism is highly asynchronous and involves a so-called “hidden intermediate”. Here I revisit this reaction in which a small change is applied to the atoms involved.

    Below are two representations of the mechanism. The synchronous mechanism involves five “curly arrows”, two of which are involved in forming a bond between oxygen and carbon, and three of which transfer a proton to the group X (X=O). The second variation asynchronously stops at the half way stage to form a pseudo ion-pair (the “hidden intermediate”) and the proton transfer only occurs in the second stage. If the ethene is substituted with deuterium, experimentally an inverse kinetic isotope effect is observed, which provides strong evidence that at the transition state, no proton transfer is occurring

    Before I go on, I should say that you will not find the mechanism as shown in either variation above in very many text books, which tend to practice “curly arrow economy” by employing only four arrows. I will not pursue this aspect here, except to note that as drawn above, the synchronous mechanism resembles that of a pericyclic reaction in a variation known as coarctate, as I noted in the original post (DOI: 10.14469/hpc/4807).

    Now I introduce a veritable variation into this reaction, known as Payne epoxidation[cite]10.1021/jo01062a004[/cite], which replaces the peracid with a reagent generated by adding hydrogen peroxide to a nitrile to generate a transient species which can be represented by X=NH above. How does this change things? The model below also uses propene rather than ethene (M062X/Def2-TZVPPD/SCRF=dichloromethane). This transition state (ΔG298 31.3 kcal/mol) shows two C-O bond formations, and as before the proton is clearly not yet transferred to the nitrogen (X=NH). Because of this asynchrony, the reaction could also be called a coarctate pseudo-pericyclic reaction.

    Asynchronous concerted mechanism. Click for 3D

    However, the proton transfer is nonetheless part of a concerted mechanism, as shown by the IRC profile.

    The gradient norm most clearly shows the “hidden ion-pair intermediate” at IRC = -1, and the proton transfer only occurs after this point is passed.

    This is even more spectacularly illustrated with a plot of dipole moment along the IRC;

    In truth, no real differences are yet revealed between the Payne reagent and the peracid. In fact, this is a real surprise, since the NH of the Payne reagent should be very much more basic than the carbonyl oxygen of the peracid. But more exploration of the potential energy surface reveals another transition state!

    Stepwise mechanism. Click for 3D

    This is seen forming the two C-O bonds AFTER the proton transfer from oxygen to nitrogen. It is 4.2 kcal/mol lower than the first transition state, which corresponds to the scheme below.

    The new ion-pair shown above is 7.1 kcal/mol higher than the previous reactant, but is so much more basic than before that the overall activation energy is indeed lowered. Two distinctly separate IRCs can be constructed for this alternative, the first a pure proton transfer (not shown) and the second a pure C-O bond forming process (below). This second step is both concerted and almost purely synchronous.

    So now we see how a small change to the reactant molecules (X=O to X=NH) can induce a reaction for which two quite different mechanisms can operate, an asynchronous one albeit with a hidden intermediate and a fully stepwise one in which a quite different, but this time real, intermediate is involved. Nevertheless for both the peracid mechanism and the peroxyimine variation shown here, the proton transfer is NOT involved in the rate limiting step. So for this variation too, inverse kinetic isotope effects would be expected.


    FAIR data for the calculations at DOI: 10.14469/hpc/4909 Thanks Ed for pointing this out.

  • Organocatalytic cyclopropanation of an enal: (computational) product stereochemical assignments.

    In the previous post, I investigated the mechanism of cyclopropanation of an enal using a benzylic chloride using a quantum chemistry based procedure. Here I take a look at the NMR spectra of the resulting cyclopropane products, with an evaluation of the original stereochemical assignments.[cite]10.1021/acs.jchemed.7b00566[/cite]

    Three products were identified, 4a-c (aryl=2,4-dinitro) with a fourth diastereomer undetected. The relative stereochemistries were assigned[cite]10.1021/acs.jchemed.7b00566[/cite] on the basis of NMR coupling constants, using the empirical Karplus or Bothner-By relationships. Here I calculate the NMR couplings at the B3LYP+GD3BJ/Def2-TZVPP/SCRF=chloroform level for a comparison, using a methyl group rather than the full n-heptyl one shown above.

    System, Data DOI

    10.14469/hpc/4650

    Gibbs Energy J1(a)-2(b) J1(a)-3(c)

    J3(c)-2(b)

    4a (1S,2R,3R) expt (R-prolinol) 4.9 9.0 7.5
    4a calc -910.861653 4.6 9.9 8.3
    -910.860816 4.4 10.7 7.9
    -910.859908 4.9 10.9 7.7
    -910.860299 5.2 8.1 8.1
    4b (1R,2R,3R) expt 9.6 5.3 6.7
    4b calc -910.859549 10.8 5.1 7.7
    4c (1S,2S,3R) expt 5.4 5.4 9.9
    4c calc -910.859820 4.2 5.5 10.4
    4d (1R,2S,3R) expt n/a
    4d calc -910.855965 10.3 9.4 9.6

    The variation resulting from rotations about the substituents (the o-nitro and the carbaldehyde) as seen for 4a can be up to ~2 Hz. This could if needed be averaged by weighting with the Boltzmann populations. Even without this procedure one can see that for the three diastereomers where values were measured, the calculated couplings agree to 1 Hz or better. This provides confirmation of the original assignments. This quantum-based method can be used in cases where simple formulaic relationships may apply less well.


    For four conformations, rotating the carbaldehyde and the o-nitro groups, as in red above.

  • Organocatalytic cyclopropanation of an enal: (computational) mechanistic understanding.

    Symbiosis between computation and experiment is increasingly evident in pedagogic journals such as J. Chemical Education. Thus an example of original laboratory experiments[cite]10.1021/ed077p271[/cite],[cite]10.1021/ed078p1266[/cite] that later became twinned with a computational counterpart.[cite]10.1021/ed500398e[/cite] So when I spotted this recent lab experiment[cite]10.1021/acs.jchemed.7b00566[/cite] I felt another twinning approaching.

    The reaction under consideration is that between dec-2-enal and 2,4-dinitrobenzyl chloride as catalysed by an α,α-diphenylprolinol trimethylsilyl ester with addition of further base (di-isopropylamine?). The proposed mechanism can be seen in figure 7 of the journal article[cite]10.1021/acs.jchemed.7b00566[/cite] and also scheme 2 of an earlier article.[cite]10.1021/acs.joc.5b02801[/cite] The following is my interpretation of their published mechanism (the compound numbering is the same as in Figure 7).

    1. The initiating step is the condensation between the alkyl enal (1) and the prolinol derivative (3), with elimination of water and the formation of a positive iminium cation (5). One might wonder at this stage what the counter ion to this cation is.
    2. 5 then reacts with 2,4-dinitrobenzyl chloride (2) with apparent elimination of HCl to form 6. This corresponds to 1,4-Michael addition to 5 with the formation of the first new  C-C bond and the creation of two new stereogenic centres.
    3. 6 then cyclises to form a second new C-C bond and a third new stereogenic centre as in 7.
    4. 7 is then hydrolysed to give the final product 4.

    A total of three (starred) stereogenic centres are therefore created in 4, implying 23 = 8 steroisomers, arranged as four diastereomers and their enantiomers. A computational mechanistic analysis might strive to cast light on the following questions.

    • Is the sequence shown in figure 7 reasonable? If not can a more reasonable cycle be constructed that has energetics corresponding to a facile reaction at 0°C?
    • What are the predicted relative yields of the four possible diastereomeric products and do they match those observed?
    • If  R=α,α-diphenylprolinol trimethylsilyl ester, then this fourth chiral centre increases the total number of stereoisomers to 16, arranged in eight pairs of diastereomers. Does this result in the diastereomers of 4 forming with an excess of one enantiomer over the other (an ee ≠ 0)?

    This post addresses just the first question (R=R’=H, R”=isopropylamine) leaving the other two questions for later analysis.

    My analysis (figure above) of the mechanism, as cast for computational analysis, differs in various details from Figure 7/Scheme 2 of the published articles.[cite]10.1021/acs.jchemed.7b00566[/cite],[cite]10.1021/acs.joc.5b02801[/cite]

    1. The issue of defining a counterion to 5 is solved by in fact starting the cycle with proton abstraction from 2 by di-isopropylamine to form a benzylic anion, as stabilized by the 2,4-dinitro groups and with the positive counter-ion being the protonated amine base.
    2. The next step is reaction between 1 and 3 to form an aminol 10, a tetrahedral intermediate.
    3. To remove water from this to form an iminium cation 5, one has to protonate the hydroxy group and this can now be done using the cationic ammonium species formed in step 5 above.
    4. The benzylic anion can now react with the iminium cation to form the first C-C bond and the first two stereocentres via 1,4-Michael addition to form 6
    5. The species 6 can now eliminate chloride anion to form the cyclopropyl iminium cation/anion pair 7, generating the 3rd stereogenic centre.
    6. Hydrolysis forms the product 4 and returns the system to the starting point in the catalytic cycle.
    7. Also included is whether an alternative mechanism is viable, involving elimination of Cl from 8 to form a “carbene”, which could then potentially add to the alkene in 1.

    Species (transition state)

    FAIR Data DOI
    10.14469/hpc/4642

    ΔG273.15, Hartree
    (ΔΔG273.15, kcal/mol)

    Structure
    (click for 3D model)

    Reactants -1837.174744 (0.0)
    TS1 -1837.150502 (15.2)
    TS2 -1837.154923 (12.4)
    TS3 -1837.147927 (16.8)
    TS4 -1837.175723 (-0.6)
    TS5 -1837.101534 (45.9)

    The (relative) free energies of the transition states at the B3LYP+GD3BJ/6-311G(d,p)/SCRF=chloroform level shown in the table above (click on the thumbnail images to show the 3D model of each transition state) reveal that the highest point corresponds to TS3, a C-C bond forming reaction. This is noteworthy because it constitutes the reaction between an ion-pair, albeit ions which are both heavily stabilized by delocalisation. Since the reaction is known to proceed over 3 hours at 0°C, the activation barrier of 16.8 kcal/mol is also entirely reasonable. TS5, the putative formation of a carbene from the benzyl chloride, has a very high barrier and in fact cyclises to form 9. This pathway can therefore be safely ignored.

    The next stage would be to investigate the stereochemical implications of this mechanism (atoms in 4 marked with a *) using the actual substituents for R and R’. Because the mechanism includes ion-pairs throughout, this does actually present some tricky issues. Unlike molecules with covalent bonds, where the shapes are relatively easy to predict, ion-pairs are more flexible and can often adopt a variety of poses, the relative energy of which is frequently determined simply by the magnitudes of their dipole moments.[cite]10.1021/acs.joc.6b02008[/cite] If I manage to sort this out, I will report back here.


    I would love to show you figure 7 here, but the publisher asserts that I would need to pay them $87.75 to do so and so you will have to acquire the article yourself to see it.

    Various guiding rules include constructing the entire catalytic cycle using exactly the same number of atoms so that the cycle can show only relative (free) energies and using neutral ion-pair models rather than just charged species alone.

    Almost all the chemical diagrams on this blog for some ten years now have been in SVG (scalable vector graphics) format. Most modern web browsers for a number of years now have had excellent support for SVG. Until recently SVG could not be generated directly from a drawing program such as e.g. ChemDraw. Instead I saved as EPS (encapsulated postscript) and then used a program called Scribus to convert to SVG. In fact with Chemdraw V18.0, the direct conversion to SVG seems to be working very well, including honoring color maps. To scale up a diagram, click on it to open a new browser window containing only it and then use the browser zoom-in control to magnify it. Unlike e.g. a pixel image, SVG images magnify/scale correctly.

    This relates to metadata as described in this post in performing a global search of any species matching this Gibbs Energy.

    If the mechanism is set up without any base, then proton abstraction must occur directly from the benzyl chloride. Under these circumstances, the barrier for proton removal is 27.5 kcal/mol, whilst that for C-C bond formation is only 13.6.

  • The “White City Trio” – The formation of an amide from an acid and an amine in non-polar solution (updated).

    White City is a small area in west london created as an exhibition site in 1908, morphing over the years into an Olympic games venue, a greyhound track, the home nearby of the BBC (British Broadcasting Corporation) and most recently the new western campus for Imperial College London. The first Imperial department to move into the MSRH (Molecular Sciences Research Hub) building is chemistry. As a personal celebration of this occasion, I here dedicate three transition states located during my first week of occupancy there, naming them the White City trio following earlier inspiration by a string trio and their own instruments.

    The chemistry revisits the mechanism of amide formation from an acid and an amine, which I first described on this blog about four years ago. I had constructed a model of one amine and one carboxylic acid, to which I added a further acid in recognition that proton transfers are a key aspect of the mechanism. When the model is quantified using quantum calculations (ωB97XD/6-311G(d,p)/SCRF=p-toluene) it resulted in a free energy barrier ΔG298 of about 22 kcal/mol. Re-reading what I wrote, I see I did rather gloss over this value, which implies a decently rapid reaction! In fact, the reaction occurs relatively slowly at the temperature of refluxing toluene. Perhaps some alarm bells should have been tinkling at this stage (although the sluggish reaction might for example instead be due to poor solubility) and so here I have a rethink of the model used to see if that modest barrier really is correct.

    The new premise is to test if the required proton transfers can instead be mediated using a second molecule of amine instead of acid; thus two molecules of carboxylic acid are now accompanied by two of amine, one of which will be used to transfer protons. The second acid is retained to facilitate comparison. As before, the mechanism is characterised by three transition states and two tetrahedral intermediates. The new mechanism is summarised below, with TS1-3 being the White City Trio.

    The free energies are summarised in the table below. TS3, the rate limiting step, is slightly lower in energy if the amine is used for the proton transfer than via carboxylic acid. This is the wrong direction; we really want the barrier to increase to explain the relative difficulty of the reaction as observed in refluxing toluene! Fear not however, the new barrier is indeed a much more sluggish 28.6 kcal/mol (30.5 using a larger basis set).

    Species

    (FAIR Data DOI 10.14469/hpc/4598)

    ΔG298 (ΔG298)

    kcal/mol

    Structure

    Ionic reactants -649.737562 (0.0)
    TS1 (N-C bond formation via acid PT) -649.702436 (22.0)
    TS1 (N-C bond formation via amine PT), the “White City” -649.702307 (22.1)
    TI1 from TS1 -649.709938 (17.3)
    TS2 (PT from N to O via acid PT) -649.713027 (15.4)
    TS2 (PT from N to O via amine PT), the “White City” -649.706042
    TI2 from TS2 -649.711481 (16.4)
    TS3 (O-C bond cleavage via amine PT), the “White City” -649.691918 (28.6) [30.5]
    TS3 (O-C bond cleavage via acid PT) -649.689910 (29.9)
    Non-ionic product from TS3 -649.732417 (+3.2)
    Ionic product after PT -649.741246 (-2.3)

    How did this happen? It’s the reactants! The original reactant model was based on the known structure of acetic acid dimer, with an amine weakly hydrogen bonded. Adding an extra amine now allows an entirely new motif to form, in which the amine disrupts the acetic dimer to form a cyclic system with a pair of very strong (-)O-H-N(+)-H-O(-) hydrogen bond units.† The original model did not have sufficient components to fully allow this to happen.

    So the White City Trio achieve a performance which helps explain why a reaction is sluggish rather than facile (normally one strives to show the opposite). Perhaps however it should be the White City quartet, in recognition that the reactant also had a role to play?


    A photograph of the building under construction can be seen here. Def2-TZVPPD basis set. There does not appear to be a recorded structure for methylammonium acetate. We hope to obtain one to check what the extended structure actually is. I will elaborate an interesting new use of this value in a separate post.

  • How FAIR are the data associated with the 2017 Molecules-of-the-Year?

    C&EN has again run a vote for the 2017 Molecules of the year. Here I take a look not just at these molecules, but at how FAIR (Findable, Accessible, Interoperable and Reusable) the data associated with these molecules actually is.

    I went about finding out as follows:

    1. The article DOI for all seven candidates was linked to the C&EN site.
    2. From there I manually tracked down the Supporting information
    3. Some of this SI gave a CCDC deposition number for crystal structure data for the molecule in question. The easiest way of going directly to the data was to use the search.datacite.org search engine and to enter the keywords CCDC + deposition number. This gives a DOI for the data, examples of which are included in the table below.
    4. In other examples, I used the CSD Conquest search program and entered the names of 2-3 of the authors of the articles. This also worked well.
    5. Most of the SI files, downloaded as PDF files also had static images of NMR spectra included. This is not active data, and hence does not fulfil the F and I of FAIR, and probably the A as well. None of it is FAIR as defined by my post here although it is actually really easy to make it so. One of the examples had ~116 spectra so unFAIRed.
    6. In another example there was also computational data, included simply as a set of XYZ coordinates and again contained in the PDF file. This too is not really FAIR, since one has to know how to extract it from this container and repurpose it. It also represents a tiny subset of the data potentially available.
    How FAIR are the data associated with the 2017 Molecules-of-the-Year?
    # Title Article DOI Data DOI
    1 Persulfurated Coronene: A New Generation of “Sunflower” 10.1021/jacs.6b12630 Data available only as PDF
    Hosted by Figshare
    The SI also has its own DOI:
    10.1021/jacs.6b12630.s001
    2 A Truncated Molecular Star 10.1021/jacs.6b12630 Crystal structure data:
    10.5517/ccdc.csd.cc1nb303
    3 Synthesis of trinorbornane 10.1039/c7cc06273g Crystal structure data:
    10.5517/ccdc.csd.cc1p7806
    4 Braiding a molecular knot with eight crossings 10.1126/science.aal1619 Crystal structure data:
    10.5517/ccdc.csd.cc1m85y0
    5 Unique physicochemical and catalytic properties dictated by the B3NO2 ring system 10.1038/nchem.2708 Crystal structure data:
    10.5517/ccdc.csd.cc1lkff0
    6 Total synthesis of mycobacterial arabinogalactan containing 92 monosaccharide units 10.1038/ncomms148510 116 NMR spectra available only as PDF. No crystal structure
    7 Nitrogen Lewis Acids 10.1021/jacs.6b12360 NMR spectra available only as PDF.
    Computed coordinates available only as PDF
    Crystal structures data:
    CCDC 1457983-1457987,1458000-1458001
    e.g. 10.5517/ccdc.csd.cc1ky4qc
    10.5517/ccdc.csd.cc1ky4rd

    The FAIRness of the data for these molecules of the year is largely rescued by the crystal structure data deposited with the CCDC in their CSD database and rendered F of FAIR by the persistent identifiers such as the (parochial) deposition numbers or the more general DOI. Now if the NMR and computational data were also covered in this way, we would be making great progress. There are of course many other types of data included with these examples, and procedures for making such data also FAIR have to be worked out by the community.

    In order to construct the table above, I had to put about two hours of effort into tracking down the items (and this only because I have done this sort of search before). Perhaps next year I might persuade C&EN to include such a table in their own article!

  • Are diazomethanes hypervalent molecules? An attempt into more insight by more “tuning” with substituents.

    Recollect the suggestion that diazomethane has hypervalent character[cite]10.1039/C5SC02076J[/cite]. When I looked into this, I came to the conclusion that it probably was mildly hypervalent, but on carbon and not nitrogen. Here I try some variations with substituents to see what light if any this casts.

    I have expanded the resonance forms of diazomethane by one structure from those shown in the previous two posts (a form by the way not considered in the original article[cite]10.1039/C5SC02076J[/cite]) to include a nitrene. This takes us back to an earlier suggestion on this blog that HC≡S≡CH is not a stable species but a higher order saddle point which distorts down to a bis-carbene, together with the suggestion that hypervalent triple bonds have the option of converting four of the six electrons into two carbene lone pairs, replacing the triple bond with a single bond. This in turn harks back to G. N. Lewis’ 101 year old idea for acetylene itself!

    To explore this mode, I start by replacing the terminal ≡N in diazomethane with a ≡C-Me group, which cannot absorb electrons into lone-pairs in the manner that nitrogen can. A ωB97XD/Def2-TZVPP calculation reveals that the linear form is a transition state for interconversion into a carbene. The IRC for the process (below) shows this carbene is ~10 kcal/mol lower than the linear “hypervalent” form. 

    NBO analysis of this transition state reveals a similar orbital pattern to diazomethane itself, including a non-bonding orbital on the H2C carbon. The Wiberg carbon bond indices are 3.6764 and N 3.6454 and the bond orders C=N 1.1390 and N=CMe 1.6192.

    ELF analysis of this transition state reveals the presence of two non-bonding pairs on the carbon atoms either side of the nitrogen but unshared with it, with populations of 1.19e and 1.37e (DFT). That nitrogen really does not like excess electrons! The four atoms C,N,C,C have ELF valence basins totalling 8.00, 6.94, 7.69 and 7.92e (DFT) or 8.07, 7.07 and 7.61e (CASSCF), suggesting that unlike diazomethane itself, the octet-excess induced hypervalence on carbon is slightly decreased.

    Pumping even more electrons in by replacing the ≡C-Me group with ≡C-NH2 does not increase any hypervalence, but does induce more electrons to reside in “lone pairs”. Of the four atoms along the chain, three have “lone pairs” associated with them, a total of 4.83e that do not contribute to bonds (valence).

    An electron withdrawing ≡C-CN group replacing the ≡C-NH2 reverses the effect of the latter, but this linear species is still a transition state for carbon isomerisation:

    Finally, combining all we have learnt by adding in nitro groups on the first carbon. This is no longer a transition state but now a stable species; the sum of the ELF basin integrations around the carbon on the left reaches 8.95e, slightly higher than the dinitro-diazomethane discussed in the previous post. The numerical Wiberg atom bond indices are C 3.8713, N 3.6898, C 3.8503, C 3.9958 and N 3.0288 for the atoms along the chain, with the first nitrogen the “least-valent”.

    So we see that “hypervalence”, or at least “octet-excess”, which is not exactly the same as hypervalence since it includes contributions from non-bonding electrons, is balanced on a knife-edge. Trying to increase the octet-excess by pumping electrons in turns the system into a transition state for carbene formation. Octet-excess is seen as a metastable property, to be relieved by geometric distortions where possible or localization of electrons into non-bonding lone pairs. And I remind yet again that no evidence has manifested in calculations of the molecules above that the central nitrogen of these diazomethane-like systems has any propensity for octet or valence-excess as implied by the formula C=N≡X.[cite]10.1039/C5SC02076J[/cite]


    FAIR data for all calculations is available at DOI: 10.14469/hpc/3476

  • Dyotropic Ring Expansion: more mechanistic reality checks.

    I noted in my WATOC conference report a presentation describing the use of calculated reaction barriers (and derived rate constants) as mechanistic reality checks. Computations, it was claimed, have now reached a level of accuracy whereby a barrier calculated as being 6 kcal/mol too high can start ringing mechanistic alarm bells. So when I came across this article[cite]10.1021/acs.orglett.7b01621[/cite] in which calculated barriers for a dyotropic ring expansion observed under mild conditions in dichloromethane as solvent were used to make mechanistic inferences, I decided to explore the mechanism a bit further.

    Shown in blue above is the reported outcome, a dyotropic transposition of a OMs group with a ring CH2 group. Shown in red are my additions.

    The observed product is a 6,6-bicyclic ring system, for which various calculated mechanistic pathways were reported (R=H)[cite]10.1021/acs.orglett.7b01621[/cite].

    1. The first involved dyotropic-like [1,2] transposition of the neutral molecule, for which barriers >39 kcal/mol were calculated[cite]10.1021/acs.orglett.7b01621[/cite]. These are certainly too high to be viable and the warning bells were certainly heeded.
    2. These bells led the authors to the hypothesis that protonation of the OMs group would facilitate the reaction (Figure 7[cite]10.1021/acs.orglett.7b01621[/cite]). Their model included the proton, but did not include any counter-ion. A barrier of 5.6 kcal/mol for this system was estimated and considered “fully compatible with the mild experimental conditions“. However, as they also noted, “a singular transition structure could not be located due to the topology of the potential energy surface” and “A nudged elastic band method (was) employed to explore how the reaction proceeds“. This latter method was new to me, but in fact since I now thought the barrier might be too low; warning bells started to ring for me now.
    3. I thought the answer might relate to the lack of a negative counter-ion to the positive proton and so I added HCl instead of H+ (red above) to create a more physically realistic model of an acid catalyst; an isolated cation is an un-physical model, unless found in e.g. a mass spectrometer. Also included were two explicit water molecules, waters that were also included in the reported models[cite]10.1021/acs.orglett.7b01621[/cite], to help stabilise what was likely to be an ion-pair like system, labelled HI in the diagram above. I will explain what HI means shortly.
    4. I used the same ωB97XD/Def2-SVPP/SCRF=DCM method as originally reported[cite]10.1021/acs.orglett.7b01621[/cite]. The inclusion of explicit HCl instead of H+ now readily allowed a transition state to be located and an IRC (intrinsic reaction coordinate) could be computed (FAIR data DOI: 10.14469/hpc/3016) as a replacement for nudged elastic bands! This profile turned out to have some remarkable features, as I will discuss below.
      • I also recomputed the reactant and transition state at the Def2-TZVPPD basis set level, which allows for a better description of negative ions (FAIR data DOI: 10.14469/hpc/3095,10.14469/hpc/3140)  and this results in a calculated ΔG195 of ~16 kcal/mol, less than the original computed transition state barriers of >39 kcal/mol and closer to the barrier required for mild experimental conditions at -78°C.
    5. An animation of the IRC at the ωB97XD/Def2-SVPP/SCRF=DCM level (10.14469/hpc/3016) is shown below. It is a concerted formally dyotropic process, albeit very asynchronous in nature in which C-OMs bond breaking precedes C migration, which in turn precedes C-OMs bond formation.
    6. The energy profile is shown below. 

      • Between IRC -13 and IRC -6, the reaction prepares for a proton transfer from HCl to the mesityl oxygen, which occurs ~IRC -4.
      • From IRC -3 to IRC +1, the profile is very flat, which probably is the cause of the original failure[cite]10.1021/acs.orglett.7b01621[/cite] to locate a transition state.
      • The region IRC -3 to +2 is where the CH2 group starts to migrate, reaching the half way point at ~ IRC 0, the transition state.
      • At IRC +4, the alkyl [1,2] migration is complete and a hidden ion-pair intermediate has formed.
      • From IRC +5 to +17, this hidden ion-pair collapses to form the final non-ionic product. In the process a second proton transfer occurs back to the chloride anion (~IRC +5).
    7. The hidden ion-pair intermediate can be seen more clearly in this plot of the energy derivative gradient norm at IRC +4. The two proton transfers can be seen very clearly as sharp features at IRC -4 and +5. 
    8. The zone of the hidden ion-pair intermediate can also be seen in this dipole moment plot.
    9. This next plot charts the changes in the length of the bond labelled (a) in the diagram above. As the CH2 migration starts to create a carbocation-mesityl anion pair, the bond connecting the two rings is now tempted to also migrate. Doing so would create a more stable tertiary carbocation centre.
    10. This is mirrored by the length of the bond labelled (b). As (a) lengthens, so (b) contracts. But then at IRC +4, the aspirations of both bonds are cruelly frustrated. The methane sulfonic acid has just lost its proton (which has returned to its original home, the chloride anion) and, as an anion, is now voraciously seeking a cation. It out-competes bond (b) and forms a C-O bond. The rejected bond (b) rapidly retreats.
    11. The knock-on effects of this battle between two electron donors can be see further afield. Here is a plot of one C-H bond length (shown above as R-C; R=H). In the expectation that bond (b) will depart, it starts to increase its hyperconjugation with the adjacent carbon, but then retreats along with bond (b).

    There are lots more fun to be had with these IRC plots, but I will stop there and try to summarise. This [1,2] dyotropic transposition only has a reasonably low barrier if an ion-pair can be formed. This in turn requires a proton as catalyst, which starts off life attached to Cl, then migrates to O to enhance the ion-pair formation, and finally returns back home to the Cl. By using just a proton (without chloride) in the original study[cite]10.1021/acs.orglett.7b01621[/cite], in effect only the region of the reaction coordinate not involving the proton transfers was studied, i.e. IRC -4 to IRC +5. That would indeed give the misleading impression of a very small barrier for the reaction. By including a larger region of the reaction coordinate with the addition of chloride, we get a more realistic model for the reaction.

    More importantly, we learn a lot more about the reaction from this better model. The most important new insights are:

    1. Beyond the transition state at IRC = 0, we have pathways for both the formation of a 6,6 bicyclic ring (the blue route in the scheme above) and an alternative 5,7 bicyclic ring product (red route above). The 6,6 product was isolated in 70% yield, which leaves open the possibility that some 5,7 product was formed but was not identified. It would be worth repeating the original synthesis to see if any such product could in fact be detected.
    2. The fact that remote substituents such as R have a response to the reaction suggests that they could be used to mediate between 6,6 and 7,5 ring formation. Perhaps some modification could be found that would lead to only 5,7 product? I will explore this computationally and report my results back presently.
    3. This may represent yet another example where reaction dynamics play a role in determining the product outcome. One transition state but two possible products!  So, as also noted in the previous post, yet another candidate for a molecular dynamics study?
  • The π-π stacking of aromatic rings: what is their closest parallel approach?

    Layer stacking in structures such as graphite is well-studied. The separation between the π-π planes is ~3.35Å, which is close to twice the estimated van der Waals (vdW) radius of carbon (1.7Å). But how much closer could such layers get, given that many other types of relatively weak interaction such as hydrogen bonding can contract the vdW distance sum by up to ~0.8Å or even more? This question was prompted by the separation calculated for the ion-pair cyclopropenium cyclopentadienide (~2.6-2.8Å).

    The search query for the Cambridge structure database is shown below.


    The query (dataDOI: 10.14469/hpc/2471) defines centroids for two benzenoid rings, both comprising only 3-coordinated carbons. The sine of an angle subtended at each centroid to the other and to one ring carbon attempts to track how parallel the two rings are (strictly speaking, 12 such angles should be included). If the sines of both angles are 1.00, then the two centroids overlap orthogonally. A search constrained to no disorder, no errors and R < 0.05 reveals 1107 hits at a centroid-centroid distance of < 3.5Å. The colour code (red) indicates the distances in the range 3.4-3.5Å, which matches that of graphite, while distances down to 3.2Å (yellow-green) are not uncommon. 

    Here is another way of representing these results, in which the centroid-centroid distances (measured from the positions of 12 carbon atoms and hence statistically more reliable than any individual atom pair distance) are multiplied by either sin(ANGa) or sin(ANGb). The number of occurrences with distances < 3.2Å is less than 32 (out of 1107).

    Taking a look at some of these outliers, PAZJEG has two entries, one with a short distance (dataDOI: 10.5517/ccsffzl) and one with a normal distance[cite]10.1002/zaac.200500292[/cite], which does tend to cast doubt on the former.

    ZOMSEB[cite]10.1039/C4RA07127A[/cite], DataDOI: 10.5517/CCZS2MF) appears to have the planes of the molecules stacked ~2.5Å apart.

    OXUDES02[cite10.1016/j.poly.2016.09.046[/cite], DataDOI: 10.5517/CCDC.CSD.CC1MBBFQ) has a separation of ~2.6Å.

    Verifying these and other outliers would require expert inspection of the crystallographic data and its refinement. This might require access to the hkl  structure factors, data which are now being “strongly encouraged” for deposition with the CSD, but which are not present for most structures deposited before ~2016. In extreme cases, the original diffraction images collected by the cameras would allow for a fully independent re-analysis, data which however is rarely if ever deposited.

    So the separation of π-π stacked six-membered benzenoid rings is only infrequently less than ~3.2Å in measured crystal structures. There are hints it might reach as short as ~2.6Å, but  such examples with values significantly less than 3.2Å do require expert validation before they can be called real. 


    ‡See structuredepositioninformation/ “We strongly encourage data to be deposited either with imbedded structure factor data or with an associated FCF or HKL structure factor file.”