Author: Henry Rzepa

  • The 100th Anniversary year of Curly Arrows.

    Chemists now use the term “curly arrows” as a language to describe the electronic rearrangements that occur when a (predominately organic) molecule transforms to another – the so called chemical reaction. It is also used to infer, via valence bond or resonance theory, what the mechanistic implications of that reaction are. It was in this latter context that the very first such usage occured in 1924[cite]bx4svt[/cite] taking the form of a letter by Robert Robinson to the secretary of the Chemical Society and “read” on December 18th 1924. The following diagram was included:

    First curly arrows

    I have commented previously on this diagram[cite10.59350/qqwk3-dgj13[/cite] and will not discuss it further here. To commemorate the 100th anniversary of their invention, I include shots of two “modern” sets of curly arrows, taken from a lecture I give to university students at the end of their first university year.

    1. The first was a new take on the peracid epoxidation of an alkene[cite]10.59350/fdy9j-9fp48[/cite] in which quantum mechanical calculations have revealed that the classic take on the curly arrow mechanism for this reaction can be split into two sets, five for the first stage of the reaction up to the transition state and two for the final stage
    Four becomes seven
    1. The second was also discussed here[cite]10.59350/rj90z-mxh96[/cite] and involves what is arguably a new type of arrow to join the existing stable – the dashed arrow (in red below). This electron transfer arrow can take place over long distances (15Å or more) and adds the concept that an arrow can have the properties of an (approximate) length as well as direction, start+points and perhaps even “curlyness”.
    Proton coupled electron transfers

    As a “language” describing mechanism and reactivity in molecules, curly arrows are still in common use, but as chemistry itself evolves into new areas, will curly arrows themselves morph into new forms, or will their use gradually decline?

  • Data Discoverability as a feature of Journal Articles.

    I can remember a time when journal articles carried selected data within their body as e.g. Tables, Figures or Experimental procedures, with the rest consigned to a box of paper deposited (for UK journals) at the British library. Then came ESI or electronic supporting information. Most recently, many journals are now including what is called a “Data availability” statement at the end of an article, which often just cites the ESI, but can increasingly  point to so-called FAIR data. The latter is especially important in the new AI-age (“FAIR is AI-Ready”). One attribute of FAIR data is that it can be associated with a DOI in addition to that assigned to the article itself, and we have been promoting the inclusion of that Data DOI in the citation list of the article.[cite]10.59350/g2p77-78m14[/cite] Since the data can also cite the article, a bidirectional link between data and article is established. ESI itself can exceed 1000 “pages” of a PDF document and examples of chemical FAIR data exceeding 62 Gbytes[cite]10.1021/acs.inorgchem.3c01506[/cite] (Also see DOI: 10.14469/hpc/10386) are known. Finding the chemical needle in that data haystack can become a serious problem. So here I illustrate a recent suggestion for moving to the next stage, namely the inclusion of a “Data Availability and Discovery” statement. The below is the text of such a statement in a recently published article.[cite]10.1039/D3DD00246B[/cite]


    Data availability and discovery statement. Available as a FAIR and AI-ready data collection accessible via doi: 10.14469/hpc/13058 for the overall collection18 and Findable by following the hierarchy of data collections identified there. The data discovery and accessibility aspects are further enabled by using one of the following methods.


    Many variations on the above search can be constructed[cite]10.59350/7jq8v-z4p56[/cite] It is also useful to note that the above syntax presents the results of the search in “human readable” form. For a machine version, either of the two forms below should be used.

    1. https://api.datacite.org/dois/?query=media.media_type:chemical/x-gaussian-log+AND+media.media_type:text/plain+AND+(titles.title:*Exo*+OR+titles.title:*Endo*)
    2. curl "https://api.datacite.org/dois/?query=media.media_type:chemical/x-gaussian-log+AND+media.media_type:text/plain+AND+(titles.title:*Exo*+OR+titles.title:*Endo*)"

    These last forms emphasise that data discovery is aimed at machine automation as well as humans.

    Finally, I ponder how machines will respond to articles containing references to such discoverability. Ideally, the machine actionable information should itself be included in the (CrossRef) metadata describing the article. At the moment that aspect is perhaps the weakest point of machine discoverability associated with journals.

  • Possible Formation of an Impossible Molecule?

    In the previous post, I explored the so-called “impossible” molecule methanetriol. It is regarded as such because the equilbrium resulting in loss of water is very facile, being exoenergic by ~14 kcal/mol in free energy. Here I explore whether changing the substituent R could result in suppressing the loss of water and stabilising the triol.

    I started (as I usually do) with a search for crystal structures, in this case containing the motif shown below (trisubstituted carbon, disubstituted oxygen and  R = H or C and any type of connecting bond), which is the species resulting from loss of R to form a trihydroxycarbenium cation.

    This produces six hits, of which  HIWQEJ[cite]brjshd[/cite] (DOI: 10.5517/cc3k560) and UYOYUD[cite]10.5517/ccvrghj[/cite] (DOI: 10.5517/ccvrghj) are both salts of trihydroxycarbenium cation (or protonated carbonic acid) itself – the counter ion being eg AsF6 or an iron system. So R needs to be a stable anion and two obvious groups are triflate (trifluoromethylsulfonate) or bis(trifluoromethanesulfonyl)azanide.

    The triflate (R=CF3SO2-O) shown below has an unusually long predicted C-O bond (1.620Å), which suggests the system is already partially ionised as shown in the top diagram. An ωB97X-D calculation [cite]10.14469/hpc/14280[/cite], DOI: 10.14469/hpc/14280) reveals the species shown below is +6.6 kcal/mol higher in free energy than the one corresponding to loss of water.


    Bis-triflamide (bis(trifluoromethanesulfonyl)azanide) goes further, helped no doubt by the formation of a second strong hydrogen bond between the two ions. It is now -11.8 kcal/mol lower in free energy compared to the species resulting from loss of water.

    So that is my candidate for a “possible” impossible molecule. Any takers for its synthesis?


    Postscript: The next higher homologue, tris(trifluoromethanesulfonyl)methanide anion + trihydroxycarbenium cation is similar to the bis-triflamide in being -12.1 kcal/mol lower than the species resulting from loss of water.


  • Exploring Methanetriol – “the Formation of an Impossible Molecule”

    What constitutes an “impossible molecule”? Well, here are two, the first being the topic of a recent article[cite]10.1021/jacs.4c02637[/cite]. The second is a favourite of organic chemistry tutors, to see if their students recognise it as an unusual (= impossible) form of a much better known molecule.

    Perhaps we could define impossible molecules into two slightly different classes.

    1. The first class is a molecule which is entirely normal in terms of its structure and bonding, but just happens to be thermodynamically less stable than an isomeric form. If all mechanistic possibilities for converting it to the more stable form are eliminated, then there is no reason it should not be detected, even though it is “impossible”. By the way, quite a number of impossible molecules have been prepared using sterics  (t-butyl groups and the like, a strategy first used perhaps 40 or so years ago) to prevent the molecule from either reacting with itself or with other molecules.
    2. The second class is a molecule where the bonding or its structure are so deviant from accepted theories of the structures of molecules that its energy is either so high that either it simply cannot be prepared in the first place, or that nothing can be done to prevent its rearrangement to a much more stable form.

    The first of the examples below falls clearly into the first category; methane triol. As reported[cite]10.1021/jacs.4c02637[/cite], this impossible molecule has now been detected both at low temperatures and in the gas phase at low pressure using time-of-flight mass spectrometry and other elegant experiments. The key is to ensure either a very low temperature or the absence of any acid catalyst to decompose it to methanol and formic acid.

    As is my usual practice in discussing any interesting molecule, I first tend to conduct a search of the CSD (Cambridge structure database) – in this case it has to be said with little hope of finding any examples. I was therefore very surprised to find one example reported, COLRUT.[cite]10.1021/acs.orglett.9b02161[/cite] The crystal structure of COLRUT can be viewed here.[cite]10.5517/ccdc.csd.cc22yztvv[/cite] (DOI: 10.5517/ccdc.csd.cc22yztvv).  Clearly, given the discussion at the top, alarm bells should be ringing about this result. When any such alarms sound, it is my second practice to turn to calculations for verification. In this case to FAIR Data calculations[cite]10.14469/hpc/14236[/cite]  (DOI: 10.14469/hpc/14236).

    The article[cite]10.1021/jacs.4c02637[/cite] also reports such calculations, but its good to have independent verification (of some of them), so I list the essential conclusions from my own calculations here.

    1. At the CCSD(T)/Def2-TZVPP level, methane triol is ΔG298 14.49 kcal/mol higher in free energy than formic acid and water. This is not really an impossibly higher energy, and the molecule is “impossible” only because there is a very facile reaction for it to undergo (acid catalysed disproportionation for example).
    2. At the much faster ωB97X-D/Def2-TZVPP level, the value is 14.48 kcal/mol, which is agrees well enough with the previous to use this method to explore further.
    3. If the C-H is replaced by C-CF3 (again a good tutorial question for how to stabilize the diol form of eg acetone), the energy of the triol is reduced to +9.4 kcal/mol. Still positive, but much smaller than the original.
    4. If the C-H is replaced by C-(CF3)3 it is still unstable by 13.6 kcal/mol. Not much chance of using substituents to create a “possible” triol then.
    5. Next, the transition state for unimolecular decomposition to water and formic acid. An IRC for this is shown below and the free energy of activation is +36.6 kcal/mol. This proceeds via a very non-linear hydrogen transfer, a geometry known to be unfavourable and indeed an energy too high for this rearrangement to occur (in a mass spectrometer? What is the temperature of molecules under these conditions?). Note how a nice hydrogen-bonded form of the products forms at the end.


      I could not resist showing the dipole moment response along the IRC. Lovely!
    6. What about an intermolecular rearrangement, which would occur at either higher pressures or perhaps higher temperatures? Now, ΔG = 26.7 kcal/mol, a more viable thermal reaction.The lower barrier is because the 6-ring transition state now allows a less bent hydrogen transfer.

    7. This is the reaction of a trimer, ΔG = 24.2 kcal/mol. The 8-ring transition state now allows almost linear hydrogen transfers. Note that all three transferring hydrogens move more or less in synchrony.
    8. The tetramer: ΔG = 24.1 kcal/mol, now via a 10-ring transition state. If you look carefully at the animation, you can now see that the hydrogen transfers have become very non-synchronous (and the transition state more ionic), although they remain almost linear.
    9. But wait, there is another isomer of the tetramer reaction, instead proceeding via an 8-ring TS, with the fourth triol molecule bonding to the transition state via four hydrogen bonds. This is very much like a stabilised protein transition state and overcomes the extra entropy of adding that fourth molecule and then some; ΔG = 18.9 kcal/mol. So at high concentrations the disproportionation of methane triol is predicted to become a facile reaction and now can only be prevented at low temperatures!<

    An NCI (non-covalent-interaction) analysis of the hydrogen bonds in this TS structure is shown below. The blue regions are hydrogen bonds. The ones labelled 1-4 are the four such interactions resulting from addition of a fourth molecule to the hydrogen transfer structure of the trimer. Click for a 3D rotatable model.

    So I hope this extended analysis of what makes an “impossible molecule” actually possible adds another dimension to the original report.[cite]10.1021/jacs.4c02637[/cite] As for that crystal structure, I will report to CCDC that it may in fact be an artefact and that they should take another look at the crystal structure data and correct it if needed. It is also interesting to explore the properties of cyclic hydrogen transfer reactions. The conclusion here is that an 8-ring transfer may be optimum, especially if it can be stabilized with four or more hydrogen bonds!

  • Detecting anomeric effects in tetrahedral boron bearing four oxygen substituents.

    In an earlier post, I discussed[cite]10.59350/dfkt5-k2b20[/cite] a phenomenon known as the “anomeric effect” exhibited by tetrahedral carbon compounds with four C-O bonds. Each oxygen itself bears two bonds and has two lone pairs, and either of these can align with one of three other C-O bonds to generate an anomeric effect. Here I change the central carbon to a boron to explore what happens, as indeed I promised earlier.

    One can identify candidates for such molecules by a constrained search of the CSD or the Cambridge structural database, as shown below.

    The four B-O distances for each compound matching the query are now subjected to further analysis, the greatest and least values are identified and the difference between them calculated.

    The results are shown in the diagram below. Three outliers are identified for close inspection.

    Each of the three candidates is also subjected to a Gaussian calculation (MD15L/Def2-TZVPP)[cite]10.14469/hpc/14092[/cite] (See DOI: 10.14469/hpc/14092)

    1. QIXREW[cite]10.1039/C4DT00080C[/cite]. This molecule is overall neutral and for which ΔrB-O = 0.193Å (MN15L/Def2-TZVPP ΔrB-O = 0.175Å). The Wiberg bond indices of longest and shortest B-O bonds are 0.486 and 0.698, Δ = 0.212Å.This is significantly larger than the best example of the C-O series, for which the largest ΔrC-O = 0.074Å and 0.137 for the Wiberg index.
    2. XOVZOY[cite]10.1021/ja8071435[/cite] is a tri-anion with intercalated Ir3+ counterion. ΔrB-O = 0.347Å. A calculation on the isolated tri-anion (with a continuum water field to help emulate the crystal environment) results in the maximum B-O bond length difference of only 0.004Å, which is dramatically different from the crystal structure. This may be an example where the counter-ion is especially important for modelling structure, or it may be simply an anomalous refinement of the crystal structure.
    3. KBDCTB, ΔrB-O measured = 0.451Å, Calculated 0.0314Å.
      This is another structure where all may not be what it seems. This again is an anionic structure and geometry optimisation of a single molecule results in a dramatic change in the internal hydrogen bonding of the species. In the crystal structure, the carboxylic acid groups all form intermolecular hydrogen bonds. Optimized as an isolated molecule, the former are no longer possible and a big conformational change occurs to allow all four carboxylic acid groups to instead form intramolecular H-bonds. In this conformation, all four B-O bonds are essentially the same length. So this might well be an example of a large change in anomeric effects due to changes in geometry induced by hydrogen bonding.

      Intermolecular H-bonds Intramolecular H-bonds

    One lesson one always learns when comparing the lengths of bonds observed in crystal structures with those calculated using quantum mechanics is that they sometimes do not match well. These mis-matches can occur for various reasons; changes in hydrogen bonding, or the presence of unmodelled counterions or simply errors in the reported crystal structure. But we might suggest from this brief foray into B-O bonds that the anomeric effects found there may indeed be larger than those of their C-O counterparts.

  • Internet Archeology: reviving a 2001 article published in the Internet Journal of Chemistry.

    In the mid to late 1990s as the Web developed, it was becoming more obvious that one area it would revolutionise was of scholarly journal publishing. Since the days of the very first scientific journals in the 1650s, the medium had been firmly rooted in paper. Even printed colour only became common (and affordable) from the 1980s. An opportunity to move away from these restrictions was provided by the Web. Early adopters of this medium in chemistry were the CLIC pilot project[cite]10.1080/13614579509516846[/cite] in 1995 and the Internet Journal of Chemistry (IJC), the latter offering “enhanced chemical publication which permits the publication of materials which cannot be published on paper and end-use customization which permits the readers to read articles prepared for their specific needs“.[cite]10.1590/S0100-40421999000200020[/cite] Publication of the latter started in January 1998, offering “authors the opportunity to enhance their articles by fully incorporating multimedia, large data sets, Java applets, color images and interactive tools.” The journal remained online for seven years, after which it was closed and the articles became inaccessible. By then many major chemistry journals had started evolving along some of the same lines, and it could be argued this journal had served its purpose of alerting both publishers and authors to these new opportunities. Here I describe how an IJC article published in 2001 was brought back to life in more or less the enhanced manner intended.[cite]10.59350/9c769-34y25[/cite]

    Entitled “The Mechanism and Design of Asymmetric Co-Arctate Br+ (Mobius) Atom Transfers Between Alkenes. A Computational Study“, an abstract of the article is still visible via services such as e.g. Scifinder, but a more complete and open metadata description which can be provided from an assigned DOI (Digital object identifier) is not available, since back in 2001 the adoption of DOIs by journals was still in its infancy. Fortunately, the original source was still available from the authors as a combination of HTML, image files and data, the latter two being hyperlinked into the body of the article. These files are in fact all that is needed to recreate the original IJC article (if not its style), using the mechanism of a data repository[cite]10.17616/R3K64N[/cite],[cite]10.25504/FAIRsharing.LEtKjT[/cite] rather than that normally designed for a journal. The procedure adopted was as follows:

    1. All the data files were uploaded to the repository as a dataset.[cite]10.14469/hpc/13929[/cite], DOI: 10.14469/hpc/13929.
    2. The metadata record generated and registered for these depositions (https://data.datacite.org/application/vnd.datacite.datacite+xml/10.14469/hpc/13929) has Access (the A of FAIR) identifiers in the form of e.g.
      1. <relatedIdentifier relatedIdentifierType="URL" relationType="HasPart">https://data.hpc.imperial.ac.uk/resolve/?doi=13929&file=1</relatedIdentifier>
      2. Descriptive metadata providing further properties if needed, such as file names and media types and file sizes can be obtained via
        • <relatedIdentifier relatedIdentifierType="URL" relationType="HasMetadata">https://data.hpc.imperial.ac.uk/resolve/?ore=13929</relatedIdentifier>
      3. These access identifiers replaced the hyperlinks in the original article HTML
        1. Originally: <a href="supplemental/3-ts-rh3.pdb">-1.5</a>
        2. Becomes: <a href="https://data.hpc.imperial.ac.uk/resolve/?doi=13929&file=54">-1.5</a>
        3. It is worth noting that there are basically two methods of accessing a file. The first relies on its relative path in a hierarchical file system. Hard-coding such a location into a URL means it may not be persistent – the hyperlink is vulnerable to “link rot” when the file system is reorganised and the path to the file changes. The second method relies on a database query, which should be rather more persistent, since the database should always incorporate any reorganisation of the internal systems. A third option (not used here) is to assign a persistent identifier to every file, and to ensure that a properly persistent direct access mechanism is described in metadata for that file.
        4. The root document for the article, given the reserved filename index.html was edited to reflect the changes in the hyperlinks.
    3. The article document index.html was now itself uploaded to the repository. In a conventional data repository, such a file invokes no specific actions, but in the repository used for this purpose it does have the reserved meaning of invoking in effect a preview or “LiveView” using the syntax
      • <iframe name="liveview" src="https://data.hpc.imperial.ac.uk/resolve/?doi=13929&file=90"
        width="100%" height="600" id="liveview"></iframe>
    4. The article now functions much in the same way it would have done on IJC, albeit in one interesting way. The regular style adopted in journals is to place the ESI or electronic supporting information files into a separate enclave, linked via the article landing page by parochial mechanisms. In this instance the article and its data files are visible on the same page – it is a data repository after all – thus elevating the data to the same status as the article. Such elevation is often referred to as making “Data a first class citizen of the publication processes“.
    5. The opportunity now arose to incorporate an interactive tool based on the use of the JSmol molecule viewer.
      • By adding an additional header to the HTML document containing a Javascript invocation of JSmol, selected data could be brought to life by creating a molecular model in a separate window.
      • This is invoked by a variation on the hyperlink shown above in section 3.2 by
        <a href="javascript:show_jmol();javascript:handle_jmol('10.14469/hpc/13933',%20';frame 1;font label 16;zoom 5;moveto 4 90 4 80 65 120;spin 3;set echo bottom left;font echo 20 serif bolditalic;color echo green;echo TS for 3 (C2 symmetry);')">Load 3D Model</a>
      • Additional tools are now provided, from activating a (molecular) vibration, calculating a chirality (if applicable) or others invoked from a pull-down menu.
      • In this example, the data is again accessed directly from a data repository, albeit by a different mechanism from that shown in 3.2 and here based only on the DOI of the data and its media type (in this case chemical/x-mdl-molfile).

    It was not the intention here to illustrate how a Journal infrastructure might work – merely to rescue an article published 23 years ago (a long time in the Internet era) from a journal that is no longer disseminating articles. In the process the article has acquired its own DOI (albeit as data and not journal article), something not available from the original journal and some level of interactivity of the type originally envisaged. The (manual) process took something around 2-3 hours to achieve, and would certainly need automating if it were to be used more than once. I take encouragement however that after so many years, it was still possible with relatively little effort to achieve this curation.

  • Detecting anomeric effects in tetrahedral carbon bearing four oxygen substituents.

    I have written a few times about the so-called “anomeric effect“, which relates to stereoelectronic interactions in molecules such as sugars bearing a tetrahedral carbon atom with at least two oxygen substituents. The effect can be detected when the two C-O bond lengths in such molecules are inspected, most obviously when one of these bonds has a very different length from the other. The effect originates when one of the lone pair of electrons on one oxygen atom uniquely overlaps with the C-O antibonding σ* on another oxygen, thus shortening the length of the donating oxygen-carbon length and lengthening the length of accepting C-O bond. Here I take a look at tetra-substituted versions of this (C(OR)4), where in theory there are up to eight lone pairs, interacting with any of three C-O bonds, giving a total of 24 possible anomeric effects in one molecule.


    We start the process with a search of the Cambridge crystal structure database, using the following search query:

    This yields 25 hits. We now want to find out what the longest and shortest C-O bonds are, and how large the difference between them is. To do this, we have to resort to applying some functions, using the calculator tool built into the Mercury analysis software. The following functions were used:

    1. Greatest('search3'.'DIST1','search3'.'DIST2','search3'.'DIST3','search3'.'DIST4')
    2. Least('search3'.'DIST1','search3'.'DIST2','search3'.'DIST3','search3'.'DIST4')
    3. Greatest('search3'.'DIST1', 'search3'.'DIST2', 'search3'.'DIST3', 'search3'.'DIST4')-Least('search3'.'DIST1', 'search3'.'DIST2', 'search3'.'DIST3', 'search3'.'DIST4')

    The results can be displayed as below, in which the difference between the two bond lengths is colour coded (red = greatest, blue = least).

    1. Here you can see that when the difference between the longest and short C-O bond lengths is small, the colour is blue.
    2. Green dots show a difference of about 0.04-0.05Å
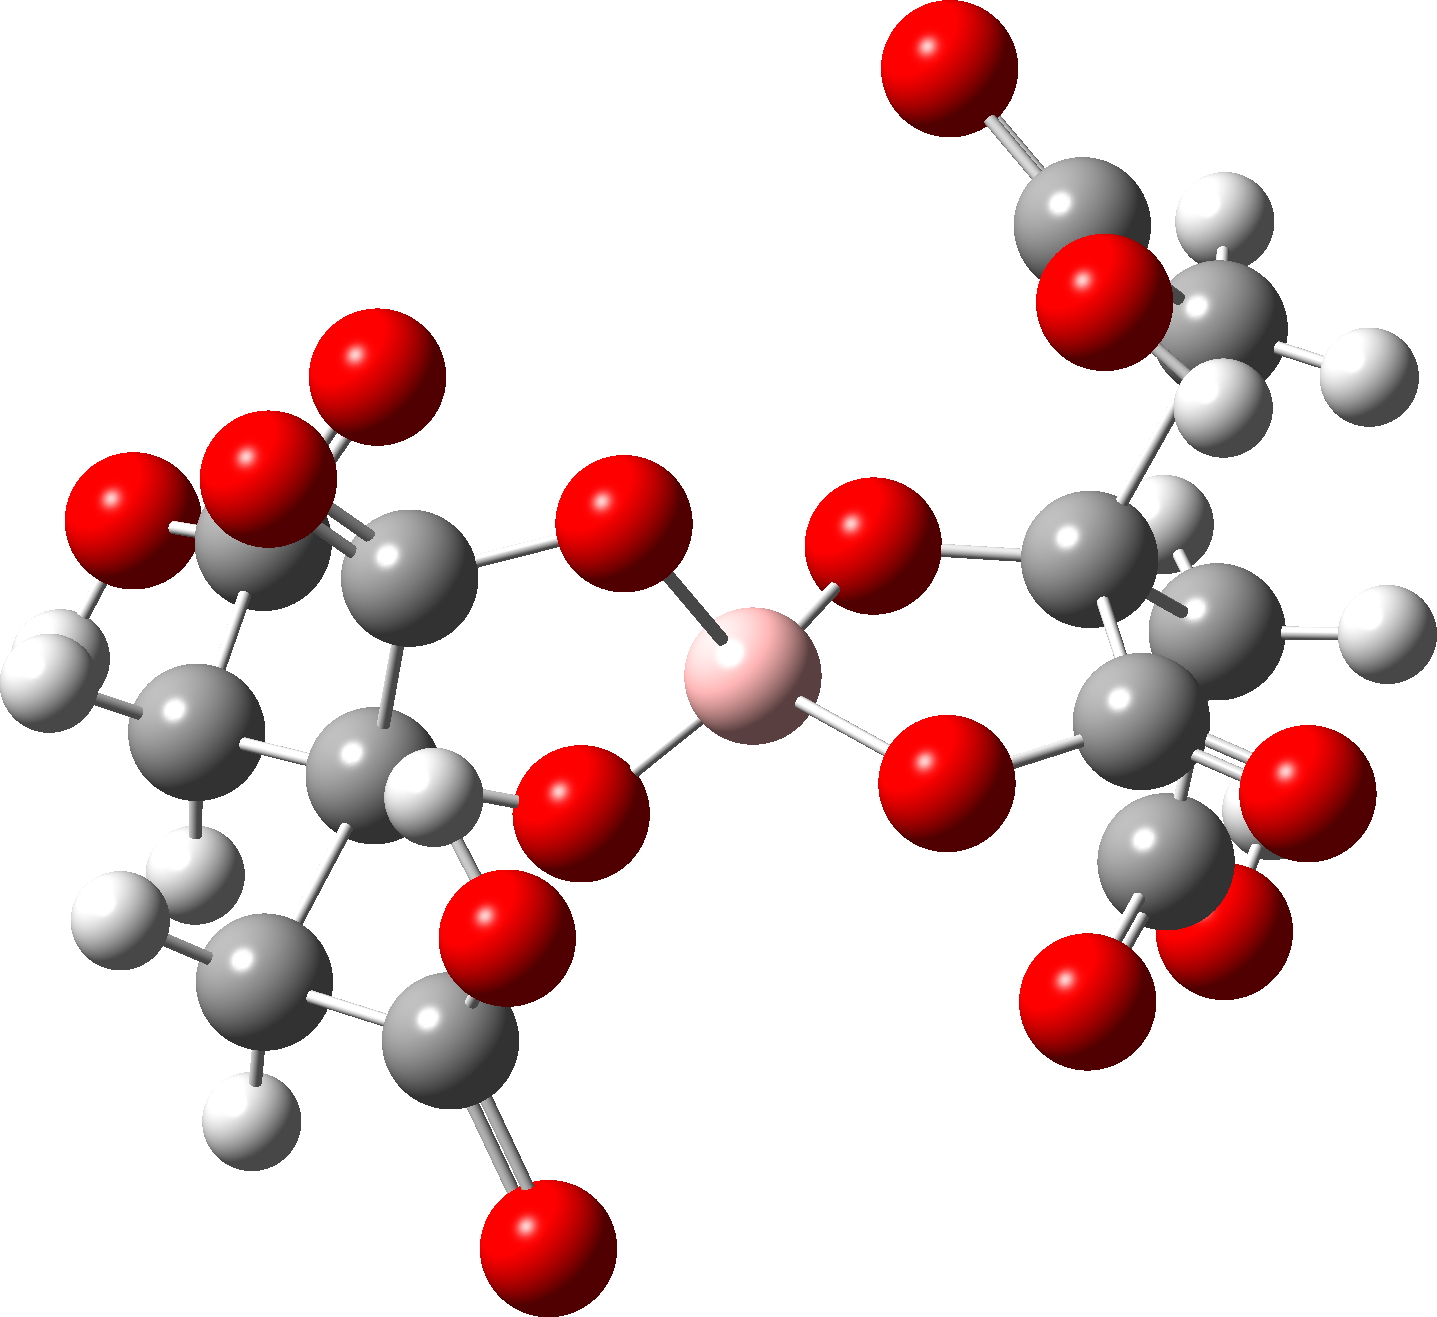
    3. The red dot has the greatest difference of 0.087Å and corresponds to the entry SILDOH ([cite]10.1107/S1600536807042298[/cite], DataDOI: [cite]10.5517/ccq8lq8[/cite], 10.5517/ccq8lq8.

    The next step is to apply a “reality check” using computation, here a MN15L/Def2-TZVPP calculation on the top eight entries as sorted by the largest C-O bond length differences (ΔrC-O > 0.05Å.[cite]10.14469/hpc/13925[/cite], data DOI: 10.14469/hpc/13925

    CCDC Ref code Crystal structure Computational structure
    Longest Shortest Δ Longest shortest Δ
    SILDOH 1.451 1.364 0.087 1.441 1.367 0.074
    PILTOU 1.432 1.361 0.071 1.418 1.378 0.040
    GISSAD 1.435 1.367 0.068 1.422 1.375 0.047
    BODGEG 1.507 1.442 0.065 1.424 1.370 0.054
    GINLOF 1.425 1.364 0.061 1.418 1.377 0.041
    POCPOO 1.419 1.361 0.058 1.421 1.371 0.050
    KEVFUM 1.417 1.361 0.056 1.395 1.391 0.004
    AHEYAO 1.423 1.370 0.053 1.422 1.372 0.050
    1. The largest effect occurs for SILDOH, and this is replicated by calculation.
    2. The largest discrepancy between measurement and calculation is for KEVFUM,  where calculation predicts almost no C-O bond differences. This will be discussed elsewhere.

    Focusing on SILDOH, we look at the NBO E(2) energies for the donor-acceptor interactions of an oxygen lone pair donating into a C-O antibonding σ* orbital.

    Click on the image below for a 3D model of the two interacting orbitals (positive overlap = blue + purple, red + orange)

    The interaction of LpO1 to the long bond C5-O4 = 18.0 and LpO2 to C5-O4 = 16.3 kcal/mol, whereas in the reverse directions, LpO4 to C5-O1 is only 6.0 kcal/mol and LpO4 to C5-O2 is 10.7 kcal/mol.  For a “normal” C-O bond however such as  C5-O3,  LpO2 to C5-O3 = 3.1 and LPO1 to C5-O3 = 5.3 kcal/mol. In effect, two oxygens “gang up” on weakening the  long C5-O4 bond, but leave the shorter C5-O3 bond alone. So the individual anomeric effects are no larger than normal, but the cooperative effect of two acting together is what produces the final geometric asymmetry.

    The Wiberg bond index mirrors this effect. The bond indices are 0.9882 for O1-C5 and C5-O4 0.8512 (Δ =-0.137) which is a big difference in bond order and accounting for the large (record?) difference in bond length.

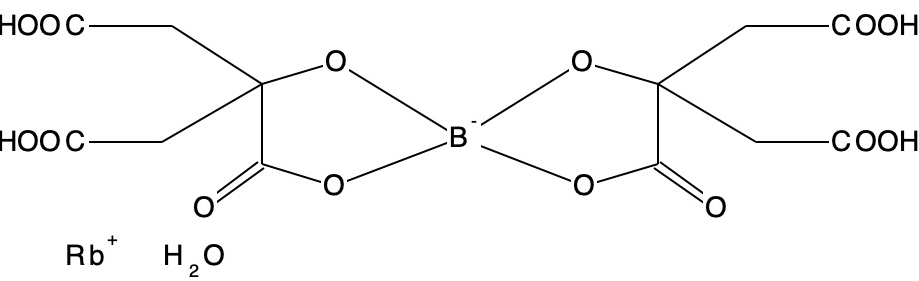
    In the next post, I will analyse the equivalent molecules B(OR)4.

  • Data Citation – a snapshot of the chemical landscape.

    The recent release of the DataCite Data Citation corpus, which has the stated aim of providing “a trusted central aggregate of all data citations to further our understanding of data usage and advance meaningful data metrics” made me want to investigate what the current state of citing data in the area of chemistry might be. Chemistry is known to be a “data rich” science (as most of the physical sciences are) and  here on this very blog I try to cite whenever possible the source(s) of the data that  I often use when discussing a topic. Such citations are not necessarily the same as citing a journal source via e.g. its DOI, although of course one is very likely to find data associated with most articles nowadays, albeit almost entirely via any associated supporting information document. However the latter is often presented in a relatively unstructured (PDF) form, which does not adhere to what are called the “FAIR” guidelines of being findable, accessible, interoperable and reusable. Directly citing data is a way of improving its FAIR-characteristics. So what insights does the Data citation corpus reveal?

    1. This overview shows that by far the most common mechanism for citing data is via its Accession Number, used predominantly by Life Sciences (an example of this latter is linked here[cite]10.1038/s41597-022-01707-6[/cite]), with the DOI (digital object identifier) being less common.
    2. Tunnelling down to citation counts in chemical sciences by publisher, an odd picture emerges with just a handful of citations.
    3. The more general physical sciences does not fare much better:
    4. Lets try a different approach, filtering by repository. Thus here are the statistics for the Cambridge crystallographic data centre, which was citing data in large amounts a few years back, but which appears to have dropped off in the last few years. Given that the entries there continue to go up almost exponentially, we begin to suspect that the data citations there are not being properly recognised as such by the citation corpus.
    5. Lets try another repository, Zenodo, which again is dropping but where the totals are about 500 a year for the most recent.
    6. OK, one more go, the RSC chemistry publisher.

    I am not sure what to make of this; areas where you would expect very high levels of data citation in chemical sciences do not appear to exist – I think for some reason, the DataCite citation corpus is not yet capturing them.[cite]10.59350/t80g1-xys37[/cite] But when things do start operating as perhaps expected, I think we will have a very valuable resource, which should firmly put data (whether FAIR or not) on the map.

  • Mechanistic templates computed for the Grubbs alkene-metathesis reaction.

    Following on from my template exploration of the Wilkinson hydrogenation catalyst, I now repeat this for the Grubbs variant of the Alkene metathesis reaction. As with the Wilkinson, here I focus on the stereochemistry of the mechanism as first suggested by Chauvin[cite]10.1002/macp.1971.021410112[/cite], an aspect lacking in eg the Wikipedia entry. As before, the diagram below is hyperlinked to the appropriate data repository identifier so that you can go straight from the scheme to the data (Top level Data DOI: [cite]10.14469/hpc/13796[/cite]).

    The essence of the reaction is the formation of a metallacyclobutane intermediate, which being approximately symmetrical with a plane of symmetry, can revert to the catalyst and an alkene in one of two ways, reforming the original alkene (two red dot carbons) or a forming a methathesised alkene (red-blue dot carbons).

    Although the mechanism is often described as a [2+2] cycloaddition in which d-orbital participation from the metal lowers the activation energy significantly, calculations at the MN15L/Def2-TZVPPD/SCRF level indicate there can be up to four discrete steps involved in the process. There are three routes involving these steps that the calculations (B3LYP+GD3+BJ/Def2-TZVPPD/SCRF=DCM) reveal (DataDOI [cite]10.14469/hpc/13796[/cite]). The starting point for all three routes is the most stable reactant catalyst (left above) which has the H-C-H carbene group in the same plane as the P-Ru-P atoms.

    1. The red route involves the following steps:
      • Activation of the catalyst by rotation of the carbene from its lowest energy orientation by 90°.
      • followed by addition of an alkene to form a π-complex –
      • then formation of a C-C bond between the alkene and the carbene (animation below). The remarkable feature of this third step is that the carbene group must again rotate through 90° (indicated with a red rotational arrow in scheme above) prior to finally forming the C-C bond.
    2. The magenta route involves only one step, in which addition of the alkene is directly followed in a second stage by C-C bond formation, via what is called the “hidden intermediate” of the alkene complex (visible at ~IRC -3 for the energy profile below)
    3. The green and final route again involves up to four steps:
      • A pseudorotation to place the two chlorine atoms di-axial,
      • next, addition of an alkene to form a π-complex
      • immediately followed C-C formation between alkene and carbene, again with twisting of the carbene group in the final step. The combined IRC for the last two of these steps (below) shows that the alkene π-complex in fact sits in shallow but real minimum, compared to it being only a “hidden intermediate” in the magenta route.

      • The reaction can either reverse as this stage to eliminate a different alkene,  or progress through one final pseudorotation step to rejoin the product of the red and magenta routes.

        Click on image above to get 3D model of the transition state.

    Of the three routes, the green one has the lowest “high energy” point, corresponding to a barrier of ΔG 14.7 kcal/mol, which corresponds to the facile room temperature reaction it is. The two almost-equal high points are the initial pseudorotation and the alkene complexation, although the final C-C bond formation is also very similar in energy.

    So we have learnt that this mechanism is actually a bit more complex than is normally shown and that two of the steps (red and green) involve a very unusual methylene rotation accompanying the C-C bond formation. No doubt, the stereoelectronic orbital interactions responsible for this are fascinating, but an analysis of these will have to wait for another post.

  • 3D Molecular model visualisation: 3 Million atoms +

    In the late 1980s, as I recollected here[cite]10.59350/g4j62-4xk50[/cite] the equipment needed for real time molecular visualisation as it became known as was still expensive, requiring custom systems such as Evans and Sutherland PS390 workstations. One major breakthrough in making such techniques generally available on less specialised equipment was achieved by Roger Sayle[cite]10.1016/s0968-0004(00)89080-5[/cite], then working at Imperial College around 1990 and using a Silicon Graphics workstation. He greatly optimised up the rendering algorithms by creating a program called RasMol (after his initials), which meant such visualisations could very rapidly also be achieved even on a personal computer. Moving from vector display technology (the PS390) to Raster/bitmap graphics had allowed spacefilling representations of molecules containing 100s if not 1000s of atoms – and in turn enabled the new World-Wide Web to exploit the technique.[cite]10.1039/C39940001907[/cite]

    Whilst Rasmol is very much still around, it also provided an inspiration for successor programs such as Jmol (based on Java) and JSMol (based on the Javascript language built into all modern web browsers). There are now many articles in the literature describing this program. In 2008 the very first post on this blog described how run it in a WordPress instance[cite]10.59350/pq7ds-gqr71[/cite].

    Now a new milestone in molecular visualisation has been reached – the ability to display 3 million atoms! Bob Hanson has just released Jmol/JSmol 16.1.51 which supports the BinaryCIF file format. An example of the power of both program and this new format is illustrated with the protein 8glv[cite]10.2210/pdb8GLV/pdb[/cite] which contains 3 million atoms (the bcif file itself is only 47.4 Mb).

    The Jmol/JSmol script to load it is:

    t = now();    
         set autobond false;
         load =8glv.bcif filter "*.CA";
         spacefill on;
         color chain;
         print now(t);

    and the actual rendering takes just 10-20 seconds. You can see from the screenshots below that when it is zoomed in, it really does show individual atoms! Who knows what the practical atom limit is, but it is almost certainly more than three million! And it may even be possible on a mobile phone!


    OK, you are asking why I have not loaded 8glv into this page? Well, I need to update JSmol on this site first and have encountered an issue that needs fixing.


    Postcript. We are getting there. Below is a screen capture of this protein using an iPhone 15 and any of Safari, FireFox, Chrome or Edge browsers via this link (ca 12 seconds on iPhone, ~30 seconds on a 2019 iMac, ~12 seconds on an M1 Mac Studio). It even spins reasonably smoothly!