Tag: Technology/Internet

  • A nice example of open data (in London).

    Living in London, travelling using public transport is often the best way to get around. Before setting out on a journey one checks the status of the network. Doing so today I came across this page: our open data from Transport for London. 

    1. I learnt that by making TFL travel data openly available, some 11,000 developers (sic!) have registered for access, out of which some 600 travel apps have emerged.
    2. The data is in XML, which makes it readily inter-operable.[cite]10.1021/ci990052b[/cite]
    3. This encourages crowd-sourced innovation.
    4. They have taken the trouble to produce an API (application programmable interface) which allows rich access to the data and information about e.g. AccidentStats, AirQuality, BikePoint, Journey, Line, Mode, Occupancy, Place, Road, Search, StopPointVehicle.

    Chemists could learn some lessons here! Of course, there are quite a few chemical databases with APIs that are examples of open data, but the “ESI” (electronic supporting information) sources which almost all published articles rely upon to disseminate data are clearly struggling to cope. Take for example this recent article[cite]10.1021/jacs.6b13229[/cite], where much of the data has been dropped into the inevitable PDF “coffin” and which is a breathtaking 907 pages long. To give the authors their due, they also provide 20 CIF files which ARE good sources of data. Rarely commented on, but clearly missing from the information associated with this (indeed most) articles is the metadata about the data. Thus the metadata for these CIF files amounts to just e.g. 229. To find out the context, one has to scour the article (or the 907 pages of the ESI) to identify compound 229 (I strongly suspect it’s a molecule because of the implied semantics of the term, not because its been explicitly declared). You will not find the metadata at e.g. data.datacite.org which is one open aggregator and global search engine based on deposited metadata.

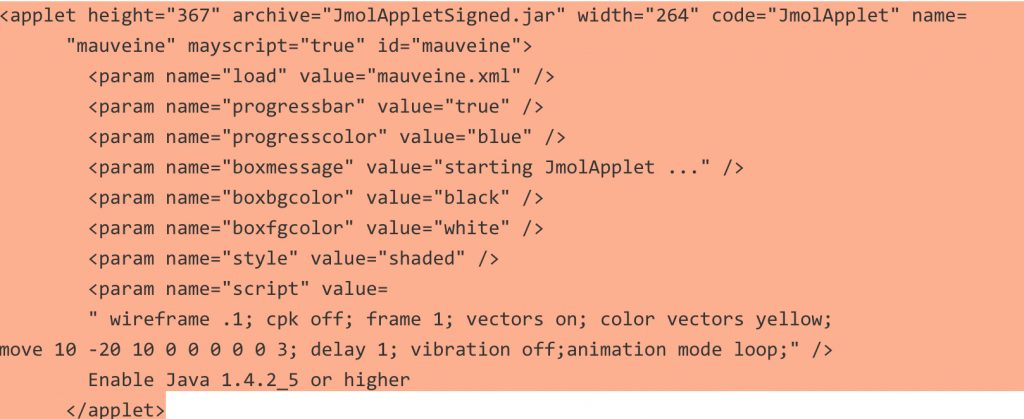
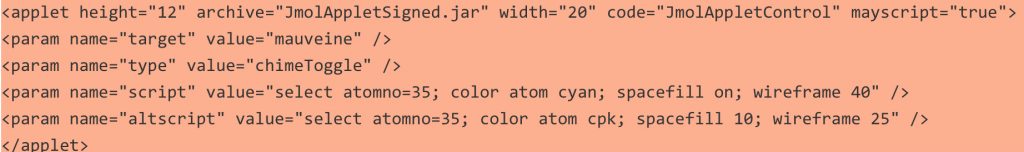
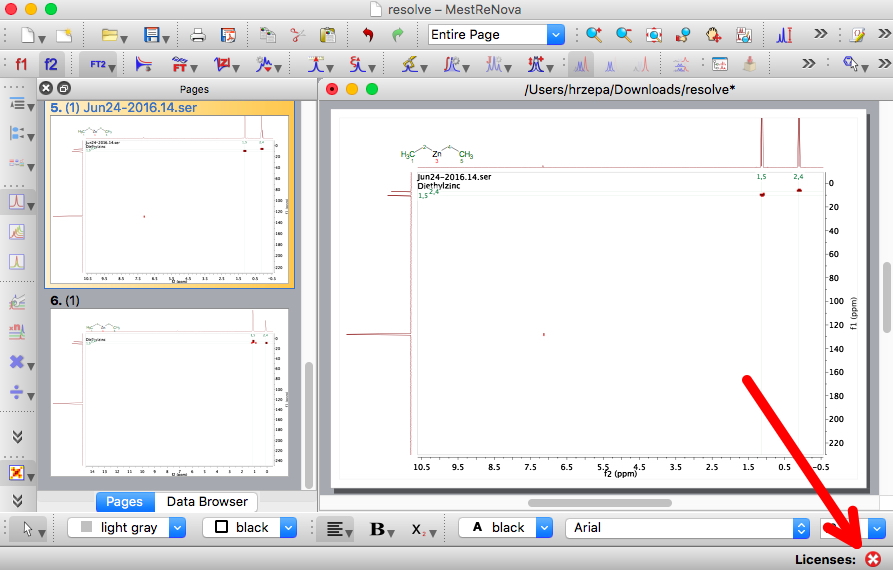
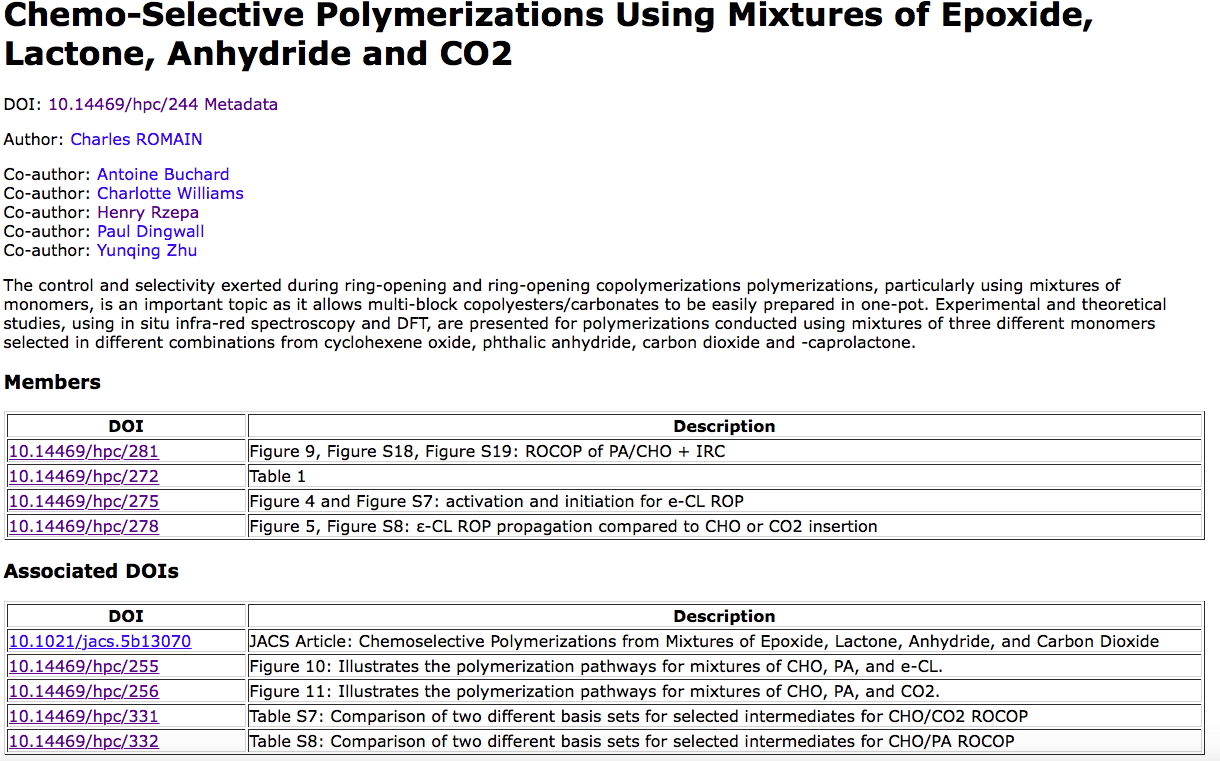
    I have commented elsewhere on this blog that other types of data could also be enhanced in the manner that CIF crystallographic files represent. For example the Mpublish NMR project, examples of which are shown here, and for which typical data AND its metadata can be seen at DOI: 10.14469/hpc/1053. I fancy that if this method had been adopted,[cite]10.1021/jacs.6b13229[/cite] those 907 pages might have shrunk somewhat, although of course not entirely. But my hope is that gradually the innovative chemistry community will find ways of exhuming more and more data from the PDF coffin and in the process reducing the paginated lengths of the PDF-based ESI further, perchance eventually even to zero?

    If you are yourself preparing an article and sweating over the ESI at this very moment, do please take a look at the Mpublish method and how perhaps it can help make your NMR data at least more useful to others.


    I understand an article describing this project is in preparation. If you cannot wait, this recent application of the Mpublish project has some details.[cite]10.1186/s13321-017-0190-6[/cite]

  • Open science and the chemistry lab of the future.

    The title refers to an upcoming symposium on the topic on 22-24 May, 2017.  I quote here some of the issues tabled for discussion:

    • Which data do we want to save, how and why and how long?
    • What really needs to be reproducible?
    • Are current reporting standards being used sufficiently?
    • Are the current procedures for depositing data too onerous for scientists?
    • Will technology, through increasing automation, fix most of the problems?
    • Is bureaucracy killing creativity in science?
    • Have we got a reproducibility crisis?
    • If we save and share data routinely, what is the future of the publication?
    • Are funding agencies causing science to be too short term in their quest for value for money?
    • Are chemists repeating too many experiments?
    • What can chemistry learn from other areas and what can they learn from chemistry?

    For more information, visit www.beilstein-institut.de/en/symposia/open-science. If you have your own questions,  or indeed comments at this stage, do append them as a comment.  I don’t know what “social media” will be used to allow people to participate (science by Twitter feed?) and whether recordings will be made, but after the event I will update here with any further interesting news.

  • Revisiting (and maintaining) a twenty year old web page. Mauveine: The First Industrial Organic Fine-Chemical.

    Almost exactly 20 years ago, I started what can be regarded as the precursor to this blog. As part of a celebration of this anniversary,[cite]10.3390/molecules22040549[/cite] I revisited the page to see whether any of it had withstood the test of time. Here I recount what I discovered.

    The site itself is at www.ch.ic.ac.uk/motm/perkin.html  and has the title “Mauveine: The First Industrial Organic Fine-Chemical” It was an application of an earlier experiment[cite]10.1039/P29950000007[/cite] to which we gave the title “Hyperactive Molecules and the World-Wide-Web Information System“. The term hyperactive was supposed to be a play on hyperlinking to the active 3D models of molecules built using their 3D coordinates. The word has another, more negative, association with food additives such as tartrazine – which can induce hyperactivity in children – and we soon discontinued the association. This page was cast as a story about a molecule local to me in two contexts; the first being that the discoverer of mauveine, W. H. Perkin, had been a student at what is now the chemistry department at Imperial College. The second was the realization that where we lived in west London was just down the road from Perkin’s manufacturing factory. Armed with (one of the first) digital cameras, a Kodak DC25, I took some pictures of the location and added them later to the web page. The page also included two sets of 3D coordinates for mauveine itself and alizarin, another dyestuff associated with the factory. These were “activated” using HTML to make use of the then very new Chime browser plugin; hence the term hyperactive molecule.

    This first effort, written in December 1995, soon needed revision in several ways. I note that I had maintained the site in 1998, 2001, 2004 and 2006. This took the form of three postscripts to add further chemical context and more recent developments and in replacing the original Chime code for Java code to support the new Jmol software (Chime itself had been discontinued, probably around 2001 or possibly 2004). With the passage of a further ten years, I now noticed that the hyperactive molecules were no longer working; the original Jmol applet was no longer considered secure by modern browsers and hence deactivated. So I replaced this old code with the latest version (14.7.5 as JmolAppletSigned.jar) and this simple fix has restored the functionality. The coordinates themselves were invoked using the HTML applet tag, which amazingly still works (the applet tag had replaced an earlier one, which I think might have been embed?).  A modern invocation would be by using e.g. the JSmol Javascript based tool and so perhaps at some stage this code will indeed need further revision when the Java-based applet is permanently disabled.

    You may also notice that the 3D coordinates are obtained from an XML document, where they are encoded using CML (chemical markup language[cite]10.1021/ci990052b[/cite]), which is another expression from the family that HTML itself comes from. That form may well last rather longer than earlier formats – still commonly used now – such as .pdb or .mol (for an MDL molfile). 

    Less successful was the attempt to include buttons which could be used to annotate the structures with highlights. These buttons no longer work and will have to be entirely replaced in the future at some stage.

    The final part of the maintenance (which I had probably also done with the earlier versions) was to re-validate the HTML code. Checking that a web page has valid HTML was always a behind-the-scenes activity which I remember doing when constructing the ECTOC conferences also back in 1995 and doing so probably does prolong the longevity of a web page. This requires “tools-of-the-trade” and I use now (and indeed did also back in 1995 or so) an industrial strength HTML editor called BBedit. To this is added an HTML validation tool, the installation of which is described at https://wiki.ch.ic.ac.uk/wiki/index.php?title=It:html5 I re-ran this again and so this 2017 version should be valid for a little while longer at least. The page itself now has not just a URL but a persistent version called a DOI (digital object identifier), which is 10.14469/hpc/2133[cite]10.14469/hpc/2133[/cite]. In theory at least, even if the web server hosting the page itself becomes defunct, the page could – if moved – be found simply from its DOI. The present URL-based hyperlink of course is tied to the server and would not work if the server stopped serving.

    To complete this revisitation, I can add here a recent result. Back in 1995, I had obtained the 3D coordinates of mauveine using molecular modelling software (MOPAC) together with a 2D structure drawing package (ChemDraw) because no crystal structure was available. Well, in 2015 such structures were finally published.[cite]10.3184/174751915X14474318419130[/cite] Twenty years on from the original “hyperactive” models, their crystal structures can be obtained from their assigned DOI, much in the same manner as is done for journal articles: Try DOI: 10.5517/CC1JLGK4[cite]10.5517/CC1JLGK4[/cite] or DOI: 10.5517/CC1JLGL5[cite]10.5517/CC1JLGL5[/cite].

    At some stage, web archaeology might become a fashionable pursuit. Twenty year old Web pages are actually not that common and it would be of interest to chart their gradual decay as security becomes more important and standards evolve and mature. One might hope that at the age of 100, they could still be readable (or certainly rescuable). During this period, the technology used to display 3D models within a web page has certainly changed considerably and may well still do so in the future. Perhaps I will revisit this page in 2037 to see how things have changed!


    The old code can still be seen at www.ch.ic.ac.uk/motm/perkin-old.html

    It should really be postscript 4.

  • OpenCon (2016)

    Another conference, a Cambridge satellite meeting of OpenCon, and I quote here its mission: “OpenCon is a platform for the next generation to learn about Open Access, Open Education, and Open Data, develop critical skills, and catalyze action toward a more open system of research and education” targeted at students and early career academic professionals. But they do allow a few “late career” professionals to attend as well!

    I could only attend the morning session, for which the keynote speaker was Erin McKiernanorcid The presentation was entitled How open science helps researchers succeedpresented as an exploration of an article written by Erin and colleagues with the same name and published in eLife[cite]10.7554/elife.16800[/cite] Erin has created a support page at http://whyopenresearch.org to augment the presentation and it’s well worth a visit.

    One striking point made was the assertion that Open publications get more citations! 
    Open publications get more citations

    As with many metrics of the impacts of the science publication processes, a citation itself lacks the context of why it was made (see this post for further discussion), but the expectation is that a citation is “good”. From my perspective as a chemist, I did wonder why molecular science was missing from the graphic above. Do open chemistry publications also get more citations?

    Which brings me to another point made during the talk, the increasingly controversial aspect of (journal) impact factors and the pressure placed on early career researchers to publish only in those with “high” impact factors, and for their careers to be assessed at least in part based on these and the anticipated “h-index”. The audience was indeed encouraged to go visit http://www.ascb.org/Dora/ (Declaration on Research Assessment, or Putting science into the assessment of research). Have you signed it yet?

    Another manifestation of the modern trend to analyse impact metrics is the site Impactstory.org. This is a scripted resource that starts from your ORCID identifier and (optionally) your Twitter account (yes, apparently Tweets matter!) to derive a more complex alternative metric of a individual’s impacts. I had not tried this one before and so I submitted my ORCID and my Twitter account, and watched as the system went off to http://orcid.scopusfeedback.com (Scopus is an Elsevier product) to attempt to create my profile. It ground for quite a while, reporting initially that I had no publications! This was followed by an unexpected error; I did not get my impact back! But this experiment served to highlight one aspect that was discussed at the meeting; data and other research objects. The graphic above refers only to the citation of journal articles, it does not yet include the citation of data. However ORCID DOES include data and research objects as works.  And because the granularity of my data and research objects is very fine (one molecule = one work), I have quite a few. In fact ~200,000! ORCID gets to about 8000 before it gives up. I suspect http://orcid.scopusfeedback.com queries ORCID, gets back ~8000 entries and crashes. No doubt the programmer tasked with implementing this resource did not anticipate that any individual could accumulate 8000+ entries! Or probably factor in that the vast majority of these would of course not be journal articles but data. If the site gets back to me about the crash I experienced, I will update here.

    Simon Deakin was the next speaker with (open) data as the focus and the worries many researchers have in being scooped by others who have re-used your open data without proper attributions. The discussion teased out that if data is properly deposited, it will indeed have full associated metadata and in particular a date stamp that could help protect an author’s interests.

    It was really good to meet so many early career researchers who espouse the open ethos. Perhaps, in 20 years time,  another graphic akin to the one above might demonstrate that open researchers get more promotions!

  • Pidapalooza!

    This is sent from the Pidapalooza event in Reykjavik, Iceland, and is a short collection of notable things I learnt or which attracted my attention.

    Firstly, what IS PIDapalooza[cite]10.5438/11.0001[/cite]? Well, it’s all about persistent identifiers, but don’t let that put you off! Another way of putting it is that it’s a way of finding things scientific on the Web. Not just publications, but conferences, social media, teaching, research datasets, infrastructure, grants, organizations, instruments, scientific objects and samples and no doubt much more. These (will) live in an inter-connected eco-system, and so the idea goes, will become an integral part of how a scientist accumulates and disseminates information nowadays. Yes, the conference itself has its own PID: 10.5438/11.0001  and the individual talks will also appear as both a collection and with their own  PID in the near future.

    1. The first example comes from WikiData, a collection of carefully curated data, from which can be dynamically assembled say a periodic table of the elements. All the data here is included from other objects, and everything is referenced by its PID. Since it’s all assembled from data, if say the name of element 118 is assigned, then it will automatically be absorbed into this presentation.
    2. This next example proved highly contentious, but is included here anyway. It is templated PIDs, as in http://doi.org/10.5446/12780#t=00:20.00:27 which allows navigation to a particular part of an object referenced by the PID. In this case a time code for a movie, but it might be say an active site in a protein, or a key atom or group in a molecular complex for example.  This might never happen (for reasons only the computer scientists currently understand!) but it does show one way in which the humble DOI might evolve.
    3. http://typeregistry.org exists for registering data types. It has almost no chemistry at the moment, but perhaps it should have! 
    4. There was a great deal about  ORCIDs, and the ways in which uses of this particular  PID are evolving.  For example, the next big effort is to use the ORCID system for organisations.  You will find my ORCID at the top of this post.
    5. PIDs are also being mooted for instruments. The idea is that instrumental capabilities, settings, calibration etc are often an integral part of the data acquisition for a project. So if data is generated using such a device, why not quote its  PID in any derived article so that others can more easily replicate a particular experiment in their own laboratory.
    6. A quote by one of the speakers was attributed to Bill Gates around 1997 “We need  banking. We don’t need banks anymore” (think how this might apply to 2016. Was he correct?).  This was followed by straw men such as: “We need publications. We don’t need publishers anymore”. Or “We need archiving. We don’t need libraries anymore”. Just like Gates’ own quote, the reality is of course far more complex.
    7. And PID fatigue;  I hope you are not getting too much of that at the moment.

    There are lots more I have learnt which I need to fix/enhance/address in our own experiments in the use of PIDs in chemistry, so I have better get on with it now!

  • The 2016 Bradley-Mason prize for open chemistry.

    Peter Murray-Rust and I are delighted to announce that the 2016 award of the Bradley-Mason prize for open chemistry goes to Jan Szopinski (UG) and Clyde Fare (PG).

    Jan’s open chemistry derives from a final year project looking at why atom charges derived from quantum chemical calculation of the electronic density represent chemical information well, but the electrostatic potential (ESP) generated from these charges is very poor and conversely charges derived from the computed electrostatic potential are incommensurate with chemical information (such as the electronegativity of atoms). He has developed a Python program called ‘repESP’ in which ‘compromise’ charges are generated which attempt to reconcile the physical world-view (fitting the ESP) with chemical insight provided by NPA (Natural Population Analysis). Jan was the main driver to making his code open source, “opening his supervisor’s eyes” to the various flavours of open source licences. To ensure that all subsequent improvements to the program remain available to anyone, the source code has been released under a ‘copyleft’ licence (GPL v3) and is maintained by Jan on GitHub, where Jan looks forward to helping new users and collaborating with contributors.

    Clyde has made various contributions to opensource chemistry over the period of his PhD, with the focus mainly on utilities to improve quantum chemical research and the enhancement of a popular machine learning library with a method that has been successful in chemometrics, creation of an opensource channel for teaching chemists programming and data analysis and creation of a tool to help encourage open sourcing software development. Cclib is the most popular library for parsing quantum chemical data from output files and Clyde has contributed patches for the Atomic simulation environment which enables control of quantum chemical codes from a unified python interface. He was responsible for the construction of a computational chemistry electronic notebook published to github and which is now under active development by others as well. This aims to encapsulate computation chemical research projects, both for the sake of reproducibility and for the sake of organising and keeping track of quantum chemical research. Alongside this platform he created an enhanced Gaussian calculator for the Atomic Simulation Environment that enables automatic construction of ONIOM input files, also now under active development. He also made contributions to scikit learn, the most popular python machine learning framework, implementing a kernel for Kernel Ridge Regression that has become the most successful kernel for regression over molecular properties. He was part of the team that won the 2014 sustainable software conference prize for creation of the opensource healthchecker software as part of Sustain. He has argued for opensource as a platform for teaching resources and created the Imperial Chemistry github user account, which is now run by the department. Materials for the Imperial Chemistry Data Analysis and Programming workshops implemented as Python Notebooks are now available through this account and continue under active development.

    Criteria for the award will include judging the submission on its immediate accessibility via public web sites, what is visible and re-usable in this way and of evidence of either community formation/engagement or re-use of materials by people other than the proposer.

  • Chemistry preprint servers (revisited).

    This week the ACS announced its intention to establish a “ChemRxiv preprint server to promote early research sharing“. This was first tried quite a few years ago, following the example of especially the physicists. As I recollect the experiment lasted about a year, attracted few submissions and even fewer of high quality. Will the concept succeed this time, in particular as promoted by a commercial publisher rather than a community of scientists (as was the original physicists model)?

    The RSC (itself a highly successful commercial publisher) has picked up on this and run its own commentary. You will find quotes from yours truly there, along with Peter Murray-Rust, a long time ardent promoter of community driven open science. One interesting aspect is that the ACS runs around 50 journals, and the decision on whether each will accept preprints for publication will (shortly = next few weeks) be made by the individual editors. I wonder if the eventual list of those supporting the project will bring any surprises (bets on J. Am. Chem. Soc. preprints anyone)?

    But I want to pick up on the declared aspiration “to promote early research sharing“. Here I couple research sharing with data sharing. If you share your research, you should also share the data resulting from that research. We are now entering a new era of data sharing (in part as a result of mandation by various funding bodies) and so one has to ask whether a pre-print server will encourage people to create and share FAIR data (data which is findable, accessible, inter-operable and re-usable) as a model to replace the current one of “supporting information” held in enormous PDF files (mostly unFAIR on at least three counts). This question is indeed posed in the RSC commentary. What I would like to see happen are projects such as that described here, which create what were described as “first class research objects”, and which I think amply fulfil the criteria of being FAIR. So, will ChemRxiv preprint servers help promote such FAIR data sharing as part of early research sharing? We will find out soon.

    The ACS supports OA (Open Access) sharing of articles, provided the authors pay (or arrange payment of) the appropriate APC or article processing charge. These charges are complex, being subject to various discounts (for example if you as an author are an ACS member or not) but are generally not insignificant (> $1000). I wondered whether preprints might be subject to an APC, and so I asked the ACS. The response was “we don’t anticipate any submission or usages fees at this time“. I think that means free at point of submission, and free at point of readership “at this time“.

    Finally, let me now summarise as I understand the current family of “research publications”:

    1. The preprint
    2. The final author version as submitted to a journal
    3. The “version of record” (VoR) as published by the journal
    4. Any FAIR published data associated with the article

    All four of these are attempts at “research sharing”. Each may be located in a different location, and each may have its own DOI. And of course we cannot easily know how much overlap there is between each of them. Thus, how might 1-3 differ in terms of the story or “narrative” of scientific claims? Does 4 agree or support 1-3? Does 4 agree with perhaps data subsets contained in 1-3? If keeping abreast of the current research literature is a challenge, imagine having to cope with/reconcile up to four versions of each “publication”! 

    Lots of food for thought here. We have not heard the last of these themes. 


  • Managing (open) NMR data: a working example using Mpublish.

    In March, I posted from the ACS meeting in San Diego on the topic of Research data: Managing spectroscopy-NMR, and noted a talk by MestreLab Research on how a tool called Mpublish in the forthcoming release of their NMR analysis software Mestrenova could help. With that release now out, the opportunity arose to test the system.

    I will start by reminding that NMR data associated with a published article is (or should be) openly free: one should not need a subscription to the journal to access it (although one might in order to find it). Now, NMR data as it emerges from a spectrometer is highly sophisticated, comprising a collection of (sometimes) binary proprietary files containing the measured free induction decays (FID). Turning this raw data into an interpretable NMR spectrum, the visual form of the data that so appeals to human beings, is non trivial. This requires what may be highly sophisticated software and that in turn means that it may be a commercial product. Of course there are also examples of non-commercial open software packages that are best-of-breed; indeed in its early life-cycle MestreNova was known as MESTREC before becoming a commercial product. Could one achieve the benefits of both open and fully functional NMR data with no loss from the original instrument coupled with the ability to apply top-quality software for its analysis in an open manner? This is a demonstration of how Mpublish achieves this.

    1. Invoke the URL data.datacite.org/chemical/x-mnpub/10.14469/hpc/1087 from a browser
    2. This action queries the metadata deposited with DataCite for the doi 10.14469/hpc/1087 and retrieves the first instance of any file associated with that dataset that has the format type chemical/x-mnpub. You can directly view this metadata by invoking just data.datacite.org/10.14469/hpc/1087 where you can find both mnpub and mnova formats listed. A command such as data.datacite.org/chemical/x-mnpub/10.14469/hpc/1087 allows the file retrieval to be incorporated into automated workflows based just on the doi and the media type desired. Note my parenthetical comment above about finding data; here you only need its doi to retrieve it!
    3. The URL above downloads a small text file with the suffix .mnpub which contains in essence two components:

      • A URL pointing directly to an .mnova file at the repository for which the doi has been issued
      • A signature key derived used to verify that the public key of the publisher (the data repository in this instance) was counter-signed by Mestrelab.
    4. If you now download the application program and install it (but for the purpose of this demonstration, ignore any requests to try to license the program. Use it unlicensed) and open the .mnpub file using it, you should get the below.The application program has checked the signature key, and if valid, proceeds to download a full data file (a .mnova file in this case), and to analyze and display it within the program. The data is fully active; it can be manipulated and analysed. Notice in the picture below, the red arrow points to the state of the license, in this case not present.
      mn
    5. It is also possible to apply this procedure to the raw data as it emerges from the (Bruker) spectrometer, and compressed into a .zip archive. The MestreNova software will automatically process the contents by applying various default parameters, although the result may not correspond exactly to that present in e.g. the equivalent .mnova file (which may have had specific parameters applied).

    It is my hope that anyone who records NMR data and processes it using software such as MestreNova will now consider using the mechanism above to accompany their submitted articles, rather than just automatically pasting a static image of the spectrum into a PDF file as "supporting information". This is part of what is meant by "managed research data" (RDM).

    One cannot help but note that many types of scientific instrument nowadays come with bespoke software for analysing the data they produce. Very often this software is unavailable to anyone who has not purchased the instrument itself. To make the data available to others, the processed data and its visual interpretation often have to be reduced, with much consequent information loss, to a lowest common denominator format such as Acrobat/PDF. Here we see a mechanism for avoiding any such information loss whilst enabling, for that dataset only, the full potential for (re)analysing the data. It will be interesting to see if other examples of this model or its equivalent emerge in the near future.


  • Data-free research data management? Not an oxymoron.

    I occasionally post about "RDM" (research data management), an activity that has recently become a formalised essential part of the research processes. I say recently formalised, since researchers have of course kept research notebooks recording their activities and their data since the dawn of science, but not always in an open and transparent manner. The desirability of doing so was revealed by the 2009 "Climategate" events. In the UK, Climategate was apparently the catalyst which persuaded the funding councils (such as the EPSRC, the Royal Society, etc) to formulate policies which required all their funded researchers to adopt the principles of RDM by May 2015 and in their future researches. An early career researcher here, anxious to conform to the funding body instructions, sent me an email a few days ago asking about one aspect of RDM which got me thinking.

    The question related to the divide between data as a separate research object (and which therefore has to be managed), and data as an inseparable part of the article narrative, which is of course ostensibly managed by the journal publication processes. Such data may often be the description of a process rather than simply tables of numbers or graphs. In chemistry it may include chemical names and chemical terms as part of an experimental procedure. For one nice illustration of such embedded data, go look at the chemical tagger page. Here the data is blending with the semantics, and the two are not easily separated. So, when such separation is not easily achieved, should the specific processes required by RDM as illustrated in the five bullet points below actually be followed?

    1. Specify a data management plan to be followed, as for example points 2-5 below.
    2. Decide upon a location for your data, separated into one for "live" or working data (the purpose simply being to ensure it is properly backed up) and the other for a sub-set of formally "published data" which has to be available for at least ten years after its publication.
    3. Use 2 to gather metadata (see 6-14 below) and in return get a DOI representing the location of the combined metadata + data, from a suitable registration authority such as DataCite.
    4. Quote this DOI(s) in the article describing the results of analysing the data and presenting hypotheses, and conversely once the article itself is allocated its own DOI from a registration authority such as CrossRef, update the metadata in item 3 so as to achieve a bidirectional link between the data and its narrative (and we assume that DataCite and CrossRef will also increasingly exchange the metadata they each hold about the items).
    5. Add both the data and the article DOIs to any institutional CRIS or current research information system (parenthetically, I regard this last stipulation as rather redundant if items 3 and 4 are working effectively, but its a good interim measure whilst the overall system matures).

    So, should step 2 be included if the data itself is inextricably intertwined with the narrative and cannot be separated? The slightly surprising advice I would suggest is yes! And the answer is that it IS possible to generate metadata (data about the, possibly entwined, data) which CAN be processed in such a step. What forms would such metadata take?

    1. Identification of the researcher(s) involved. This would nowadays take the form of an ORCID (Open Research and Collaborator Identifier).
    2. Identification of the hosting institution where the data has been produced. There is currently no equivalent to an ORCID for institutions, but it is very likely to come in the future.
    3. A date stamp formalising when the (meta)data is actually deposited.
    4. A title for the project being described. Here we see a blurring between the narrative/article and the data; a title is the shortest possible description of the narrative/article, and it may also apply to the data object(s) or it could have its own title.
    5. A slightly fuller abstract of the project being described. Here we see further blurring between the narrative and data objects.
    6. One can include "related identifiers", in particular the DOIs of any other relevant articles that might have been published which may expand the context of the data, and also the DOIs of any other relevant datasets which may have been allocated in step 2 above.
    7. It is also beneficial to include "chemical identifiers". These can take the form of InChI strings and InChI keys, which allow discretely defined molecular objects which were the object of the research to be tracked and which relate to both the narrative and any other data objects.
    8. If specific software has been used to analyse data, it too can be included as a "related identifier" (e.g. [cite]10.5281/zenodo.19272[/cite]
    9. Potentially at least, if a well-defined instrument has been involved, it too could be included with its own "related identifier". With both 13-14, other issues may need addressing, such as versioning etc, but this no doubt will be sorted in due course.
    10. etc.

    So items such as 6-14 can be collected and sent to e.g. DataCite with a DOI received in return as part of item 2 of the RDM processes. No "pure" data need be involved, only metadata. Nonetheless such metadata can only increase the visibility and discoverability of the research, as illustrated in how such metadata can be searched for the components described above.

  • Collaborative FAIR data sharing.

    I want to describe a recent attempt by a group of collaborators to share the research data associated with their just published article.[cite]10.1021/jacs.5b13070[/cite]

    I am here introducing things in a hierarchical form (i.e. not necessarily the serial order in which actions were taken).

    1. The data repository selected for the data sharing is described by (m3data) doi: 10.17616/R3K64N[cite]10.17616/R3K64N[/cite]
    2. A collaborative project collection was established on this repository (doi: 10.14469/hpc/244[cite]10.14469/hpc/244[/cite]). This data collection has some of the following attributes:
    3. Its metadata is sent here: https://search.datacite.org/ui?&q=10.14469/hpc/244 where it can be queried for other details.
    4. The project collaborators are all identified by their ORCID, used to obtain further individual information about the researchers. This information is also propagated to the metadata sent to DataCite.
    5. In the section labelled associated DOIs there is a link to the recently published peer-reviewed article, which itself cites the data via doi: 10.14469/hpc/244 and which thus establishes a bidirectional link between the article and its data.
    6. Also in the associated DOIs section are other DOIs (to two figures and two tables) held in a separate location. One example: doi: 10.14469/hpc/332[cite]10.14469/hpc/332[/cite]) which illustrates the original type of data sharing we started about 10 years ago. This form has been variously called a "WEO" or Web-enhanced object (by the ACS) or interactivity boxes (RSC, etc). In such WEOs, we wrap the data into an interactive visual appearance using Jmol or JSmol software. The data itself is directly available to the reader using the Jmol export functions (right mouse click in the visual window).


      • In this specific example the WEO has been assigned its DOI using the repository noted above.[cite]10.17616/R3K64N[/cite] 
      • We have in the past also used Figshare[cite]10.17616/R3PK5R[/cite]) for this purpose, see e.g. 10.6084/m9.figshare.1181739
      • The WEO itself can itself reference a more complete set of data used to create the visual appearance, for example data that allows the wavefunction of the molecule to be computed,  doi: 10.6084/m9.figshare.2581987.v1[cite]10.6084/m9.figshare.2581987.v1[/cite] In this instance this is held on the Figshare[cite]10.17616/R3PK5R[/cite] repository.
    7. The collection has another section labelled Members. These are individual datasets associated with the collection and held on the SAME repository as the collection itself. In this case, there are five such members, two of which are listed below:


      1. 10.14469/hpc/281[cite]10.14469/hpc/281[/cite] contains a variety of other data such as outputs from an IRC (intrinsic reaction coordinate), energy profile diagrams and ZIP archives of other calculations.
      2. 10.14469/hpc/272[cite]10.14469/hpc/272[/cite] itself contains five members, one of which is e.g.


        • 10.14469/hpc/267[cite]10.14469/hpc/267[/cite] which contains a ZIP archive with NMR data (see here for how this might be packaged in the future) and a file for a GPC (chromatography) instrument.
        • This last item also contains a new section labelled Metadata, which includes e.g. the InChI key and InChI string for the molecule whose properties are reported.

    If this mode of presenting data seems a little more complex than a single monolithic PDF file, its because its designed for:

    1. collaboration between scientists, potentially at different locations and institutions.
    2. attribution of provenance/credit for the individual items (via ORCID).
    3. separate date stamping by the various contributors.
    4. providing bi-directional links between data and publications.
    5. holding what we call FAIR (findable, accessible, interoperable and reusable) data, rather than just data encapsulated in a PDF file.
    6. Collecting, storing and sending metadata for aggregation in a formal way, i.e. to DataCite using a formal schema to render the metadata properly searchable.

    Thus 10.14469/hpc/244 represents our most complex attempt yet at such collaborative FAIR data sharing with multiple contributors. The tools for packaging many of the datasets are still quite limited (see again here) and the design is still being optimised (call it α). When the repository[cite]10.17616/R3K64N[/cite] has been more extensively tested, we intend to make it available as open source for others to experiment with. And of course, when this happens the source code too will have its own DOI!


    A refactoring of the Figshare site in December 2015 meant that the DOI no longer points directly to the WEO, and you have to follow a manually inserted link on that page to see it.